
The UK Textile Industry 1968-1970
An interesting design to show the timeline of information.
20th Century Death
A flat infographic categorising all the major causes of death the the 20th Century.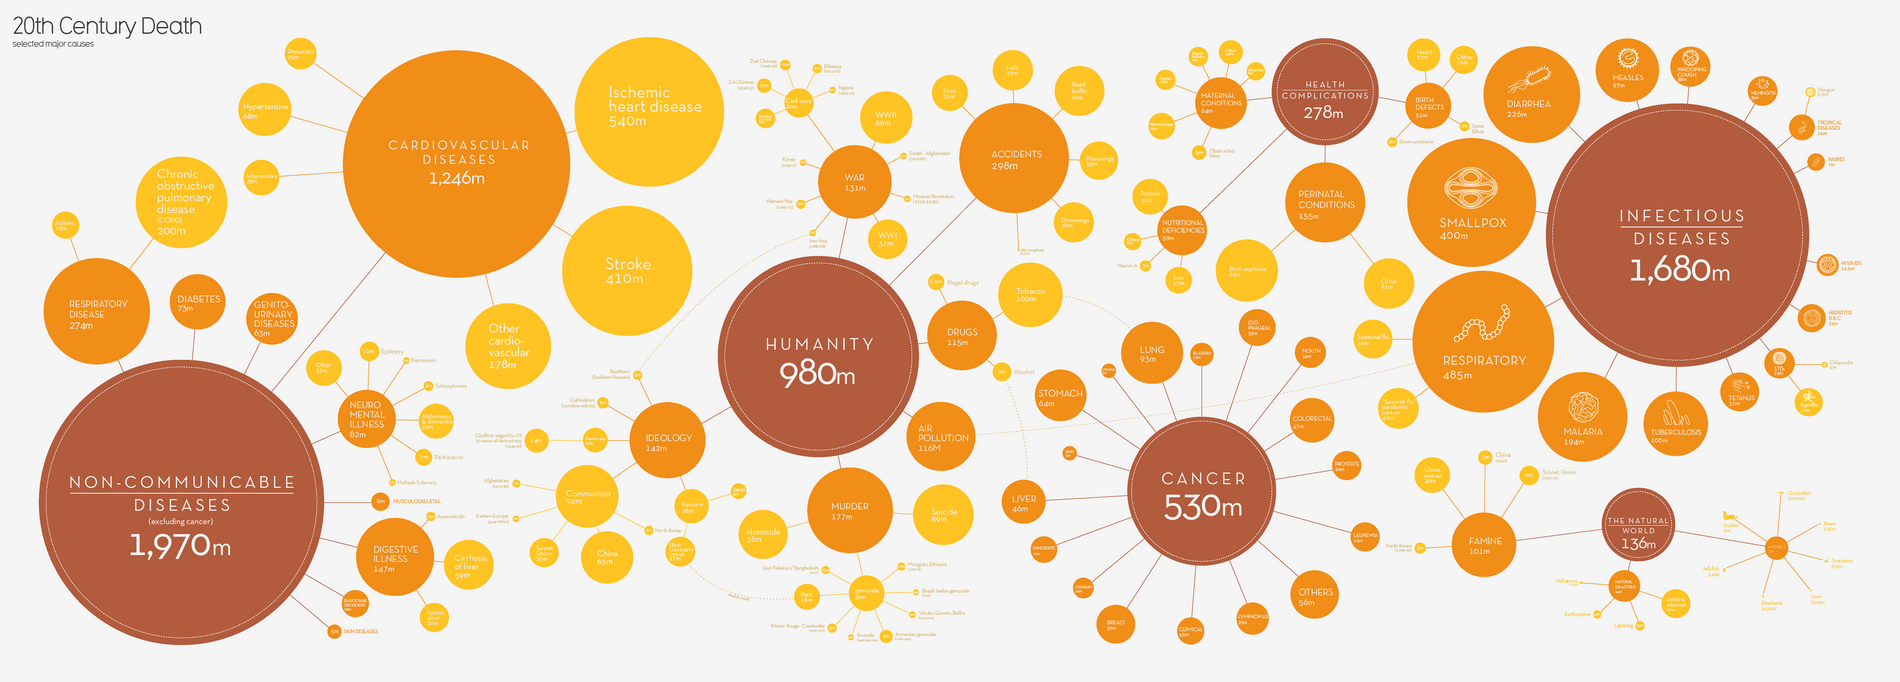
The Cost of Housing around the World
The mortgage and rent index of countries around the world. Mortgage index refers to the percentage one must spend of their income to afford their mortgages. Rent index refers to the percentage of average rent as compared to the rent in New York City. All data is based on highly populated metropolitan areas in each country.Essentially a bar chart, line chart and histogram where the x-axis has been wrapped into a circle. But I like it.

Climate of Cities
This is graph plots the mean temperature of warmest months against coldest months for various cities and divides the result by climate.
Lexical Distance Among the Languages of Europe
A good diagram showing the relationship between all of the languages in Europe.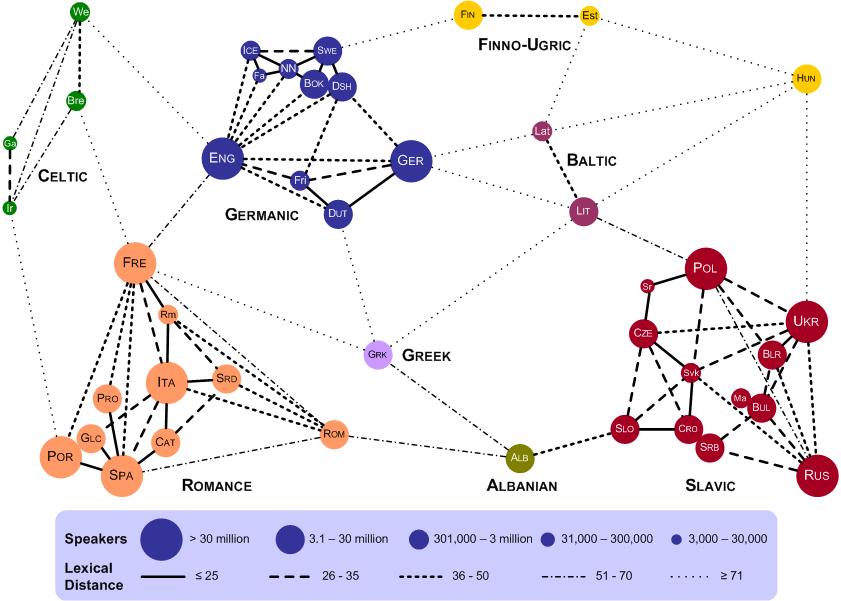
A world of languages
Graphs all the mother tongues in the world and the countries in which they are spoken.
Birth of the pie chart
Florence Nightingale was presenting data on deaths in the Crimea to a parliamentary committee. Previously trends in this data were obscured by the fact it was just a sheet of numbers. But Nightingale used this pie-like chart to display this data to the parliamentarians. It was understood and she got her point across.
The comings and goings of unemployment and inflation since 2002
A graph of the economic situation in Brazil over the last two presidents, Lula and Dilma. What started with the hope of Lula has descended into the despair of Dilma’s second term. This graph is in Portuguese, but to understand it all you need to know is that inflação = inflation, and desemprego = unemployment.
How Long Have You Lived, Doctor?
Shows the amount of screen time each incarnation of Doctor Who has had.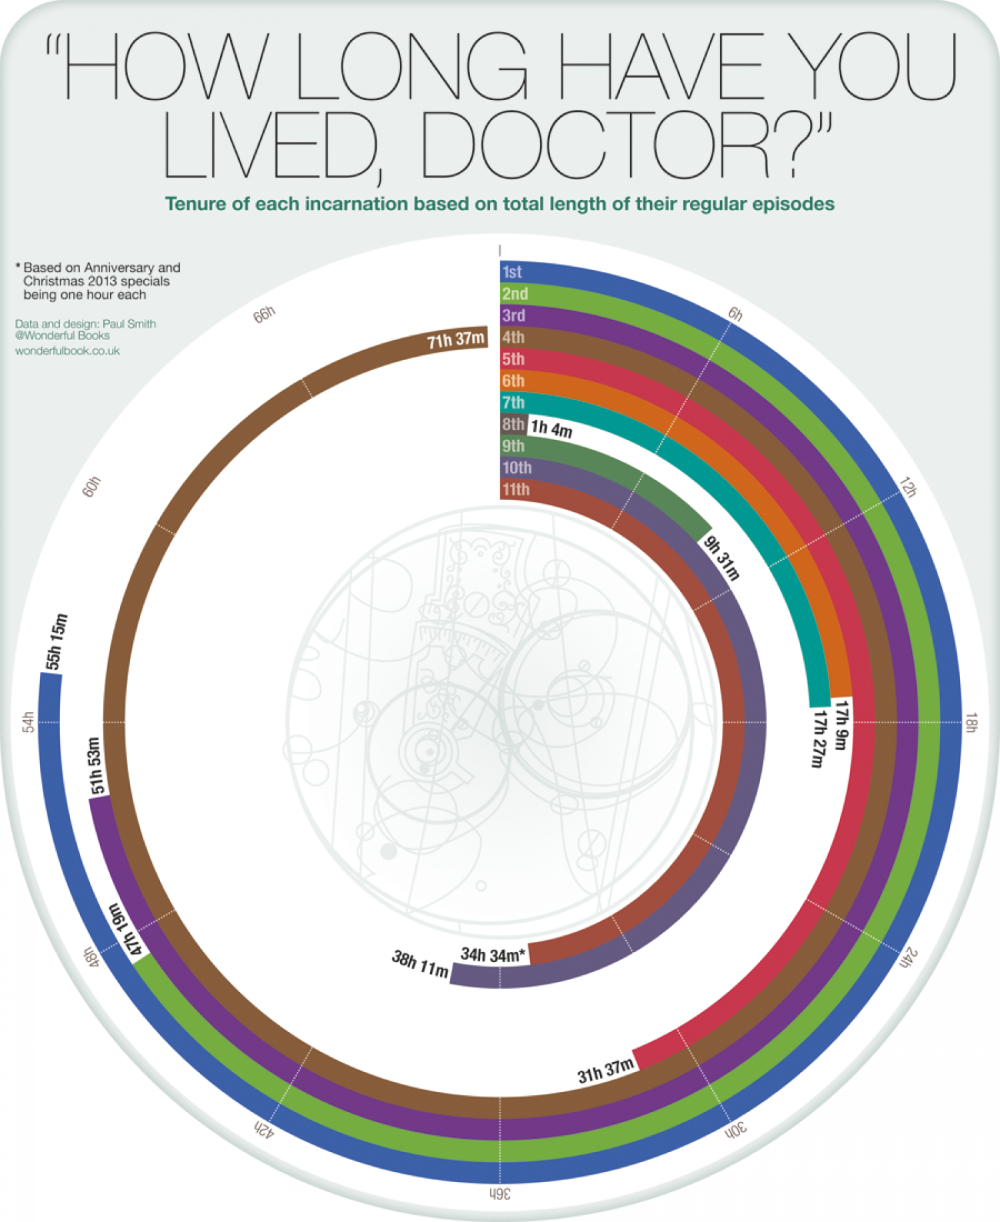
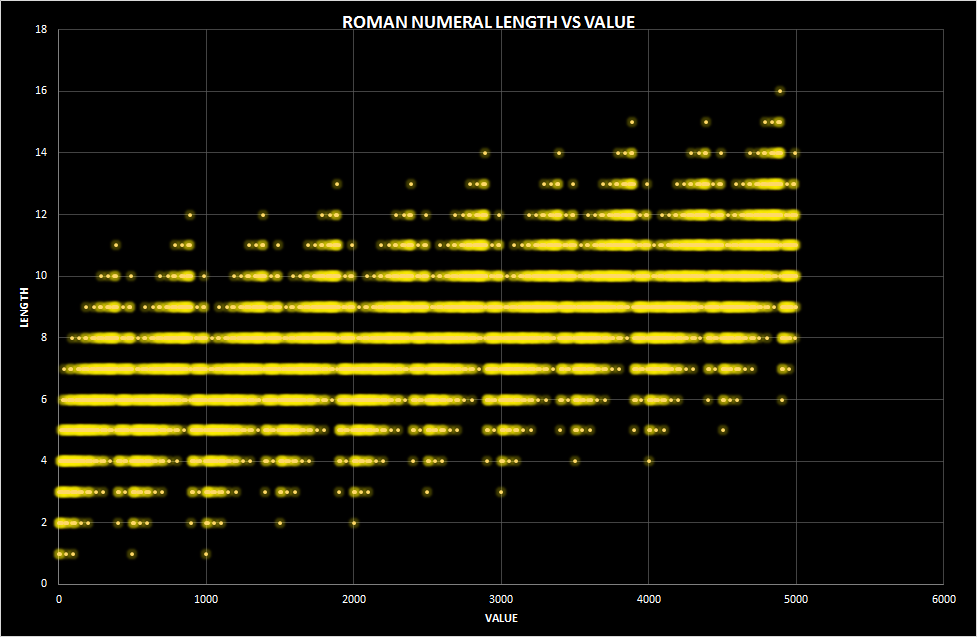
Roman Numeral Length vs Value
Options according to Yoda
A pie chart