
Population Gravity
This map shows the geographic centre of gravity and the poulation center of gravity compared to the capital of each country.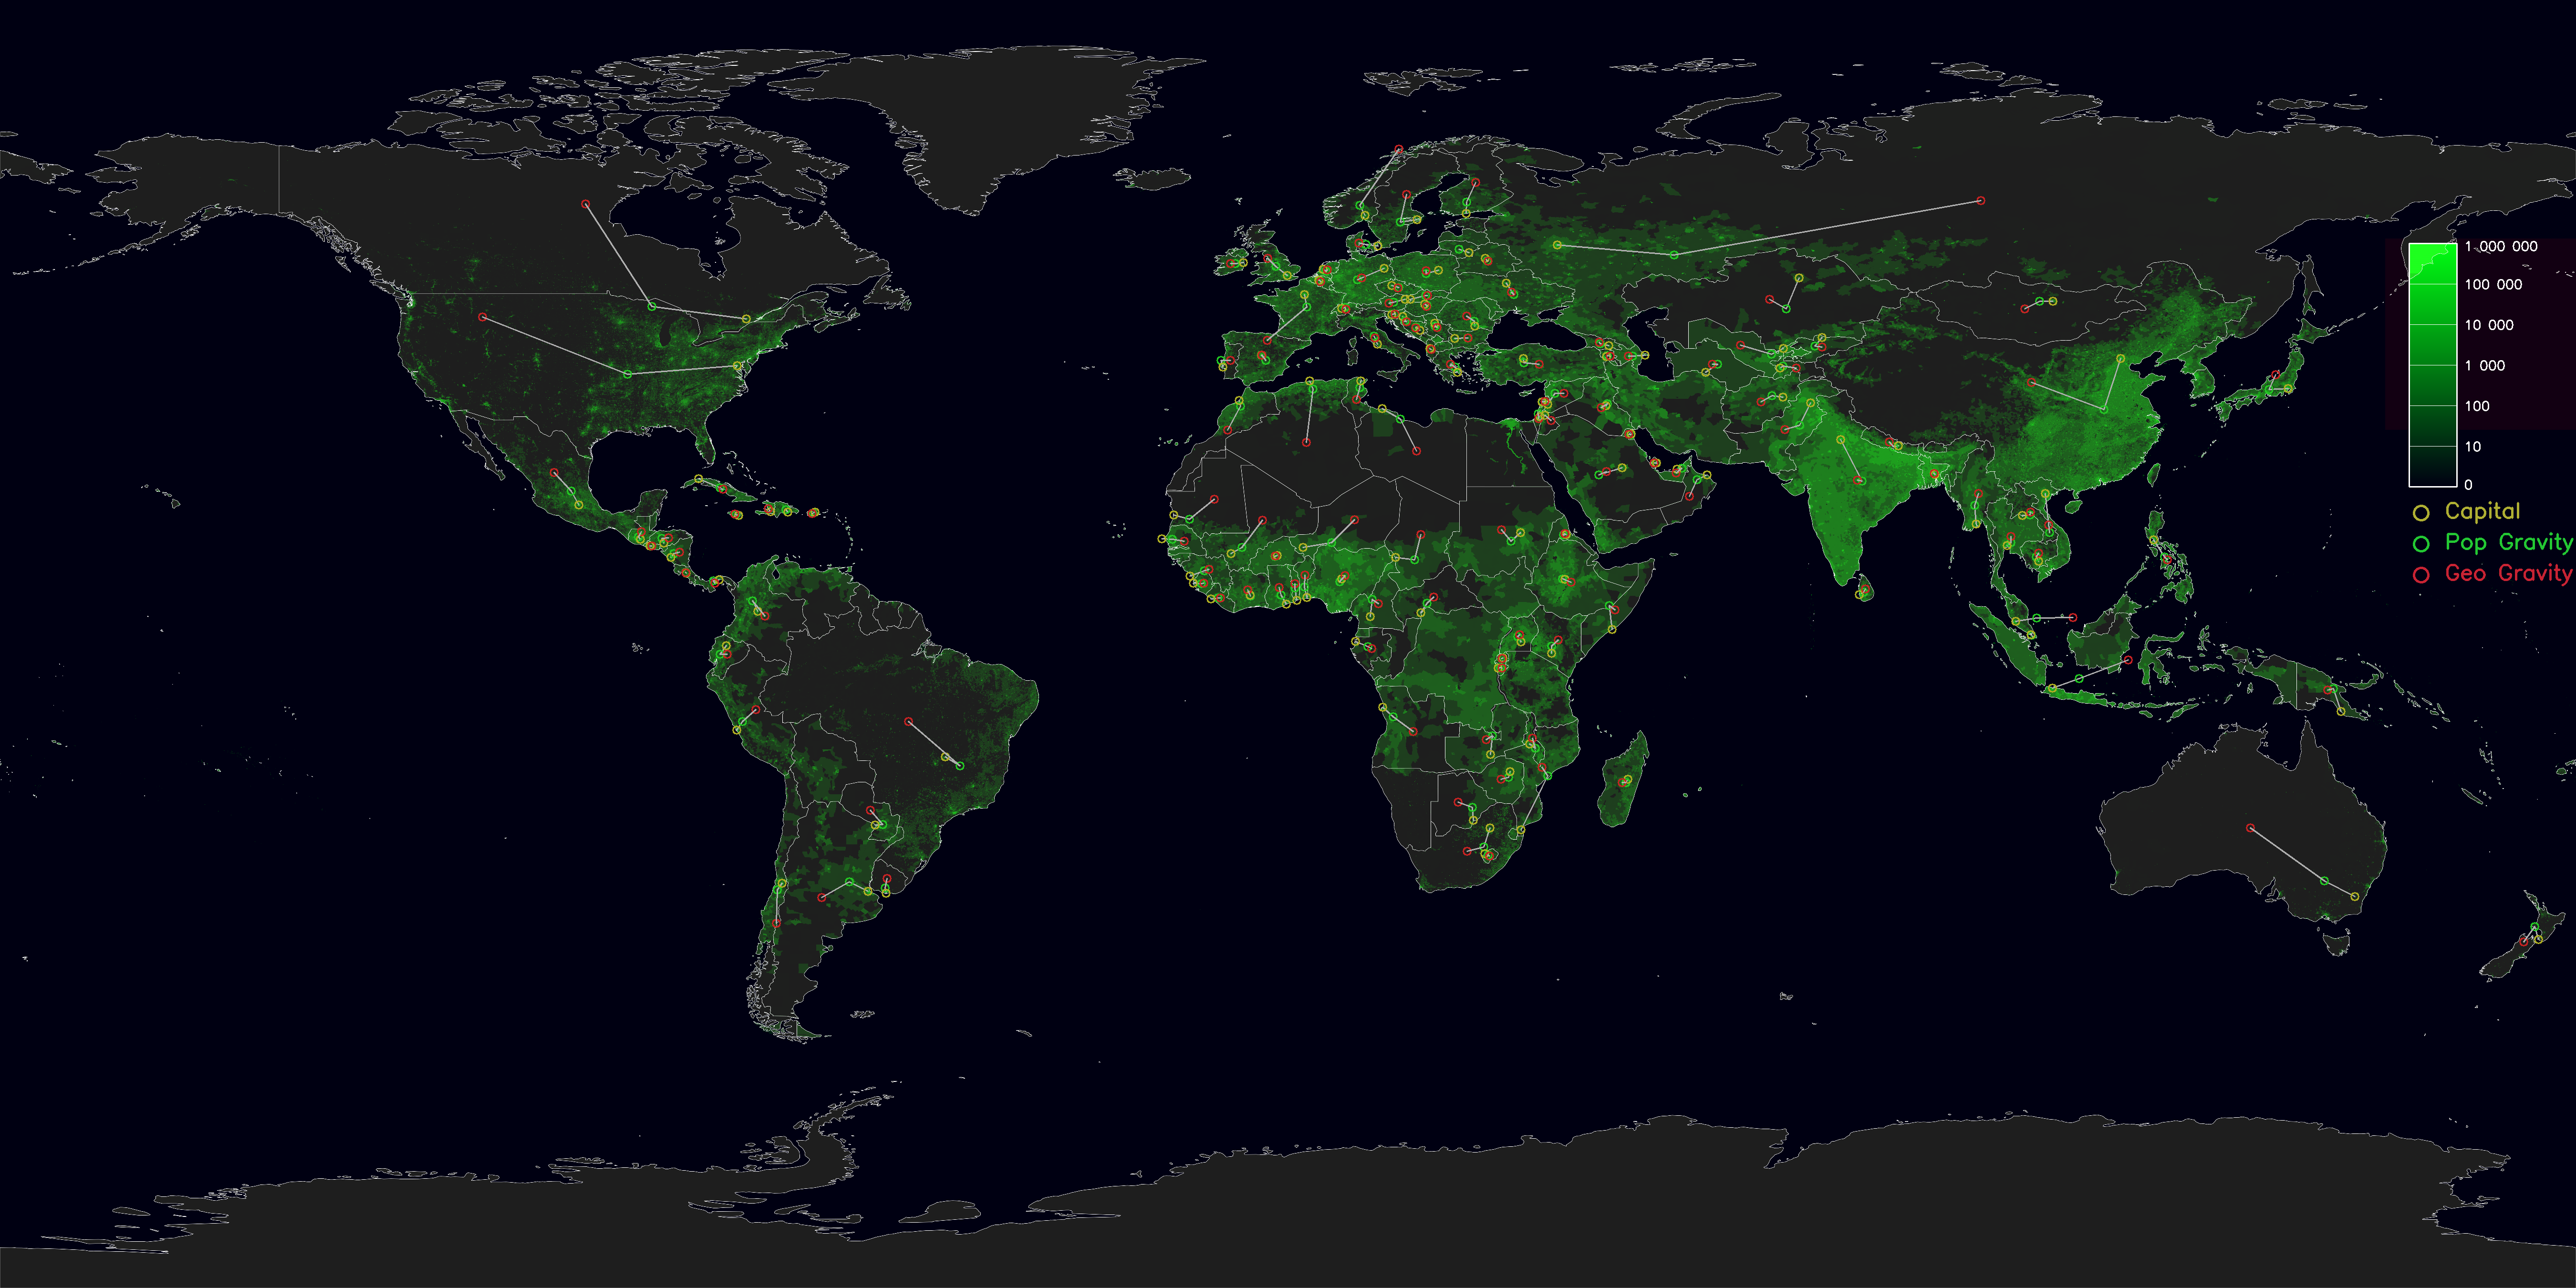
International Number Ones
Because every country is good at something.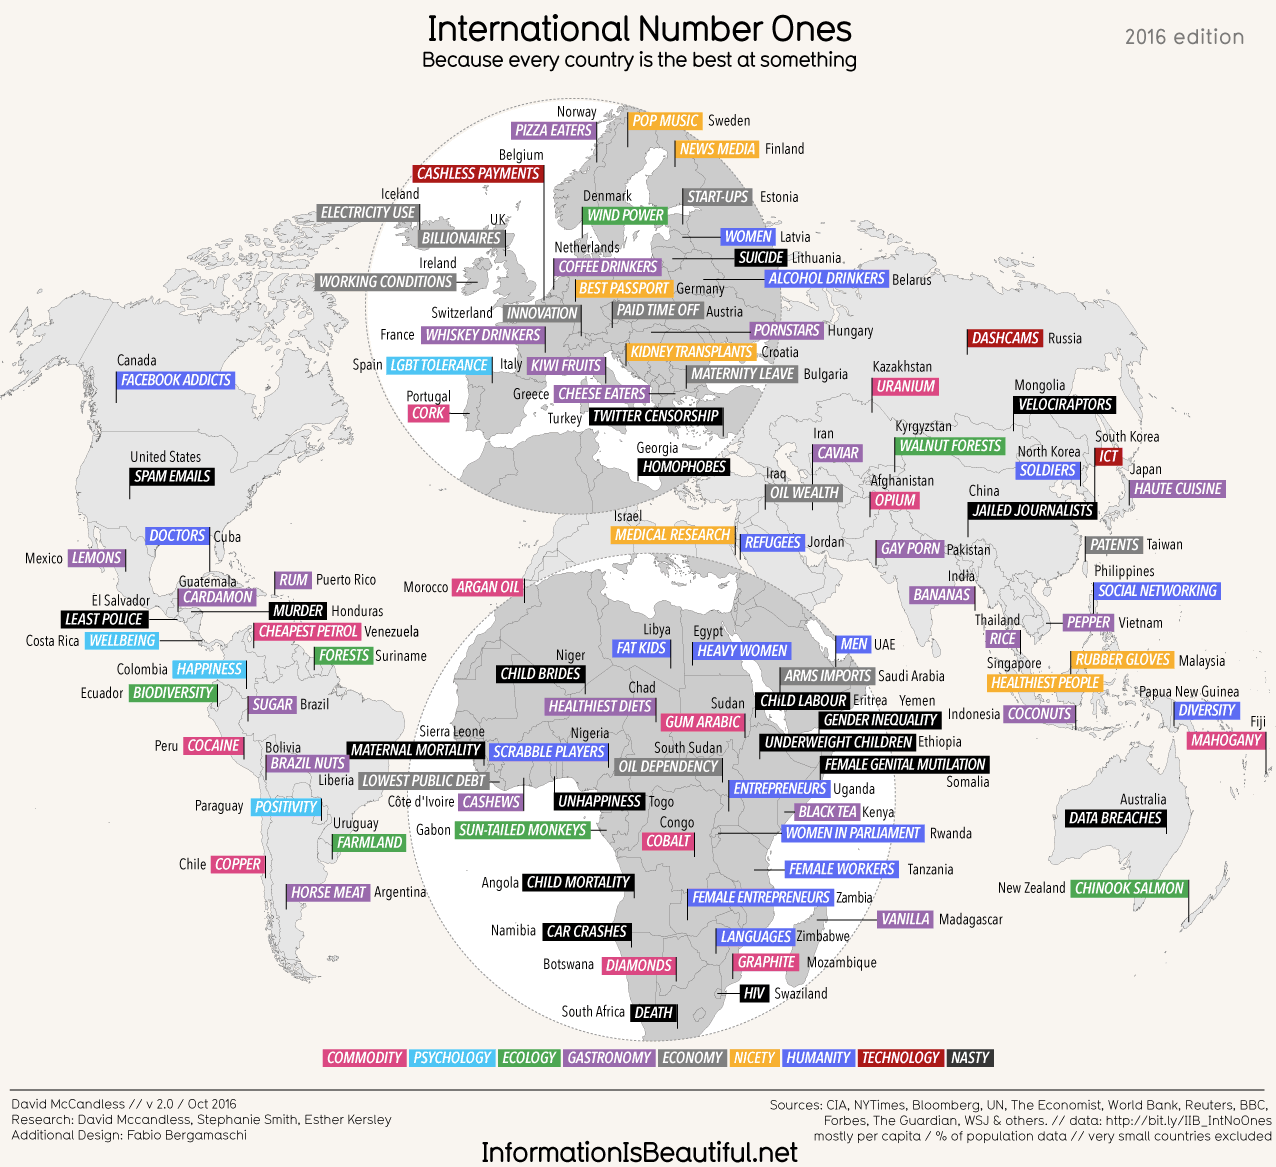
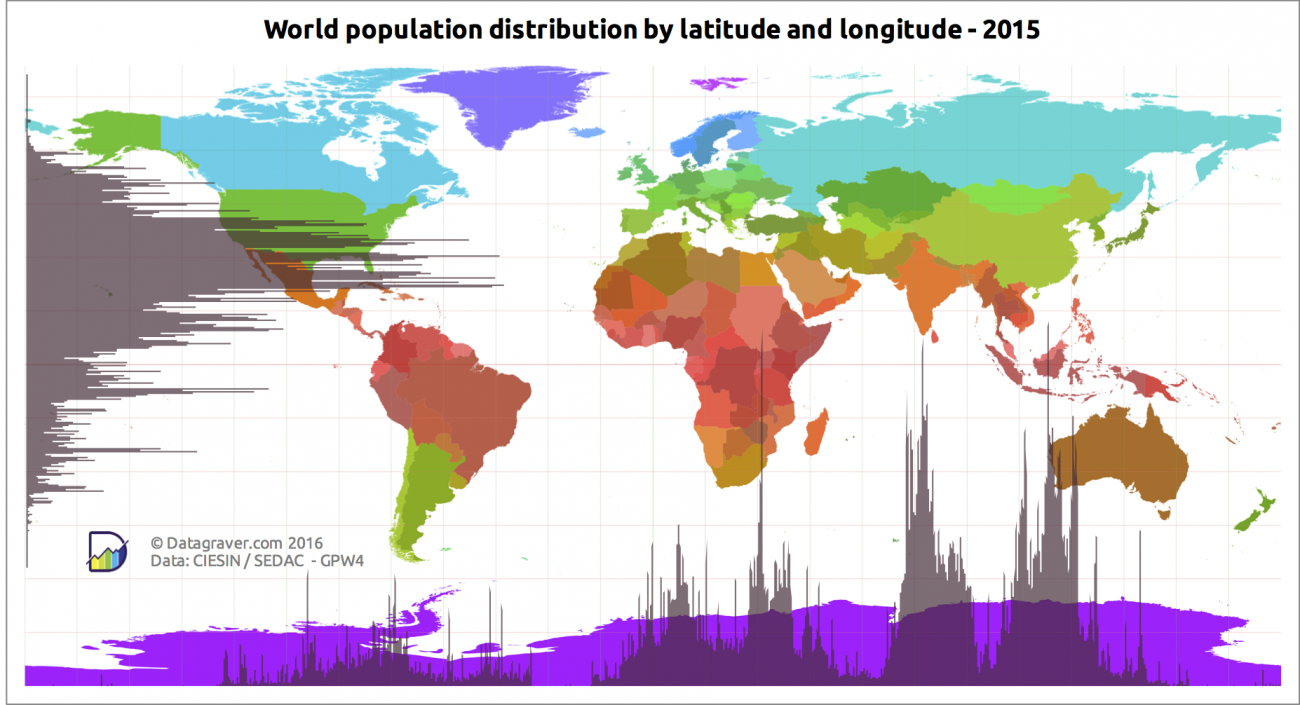
World population distribution by latitude and longitude
Mapping the online world
This map represents each country by the size of its top level domain’s usage on the internet.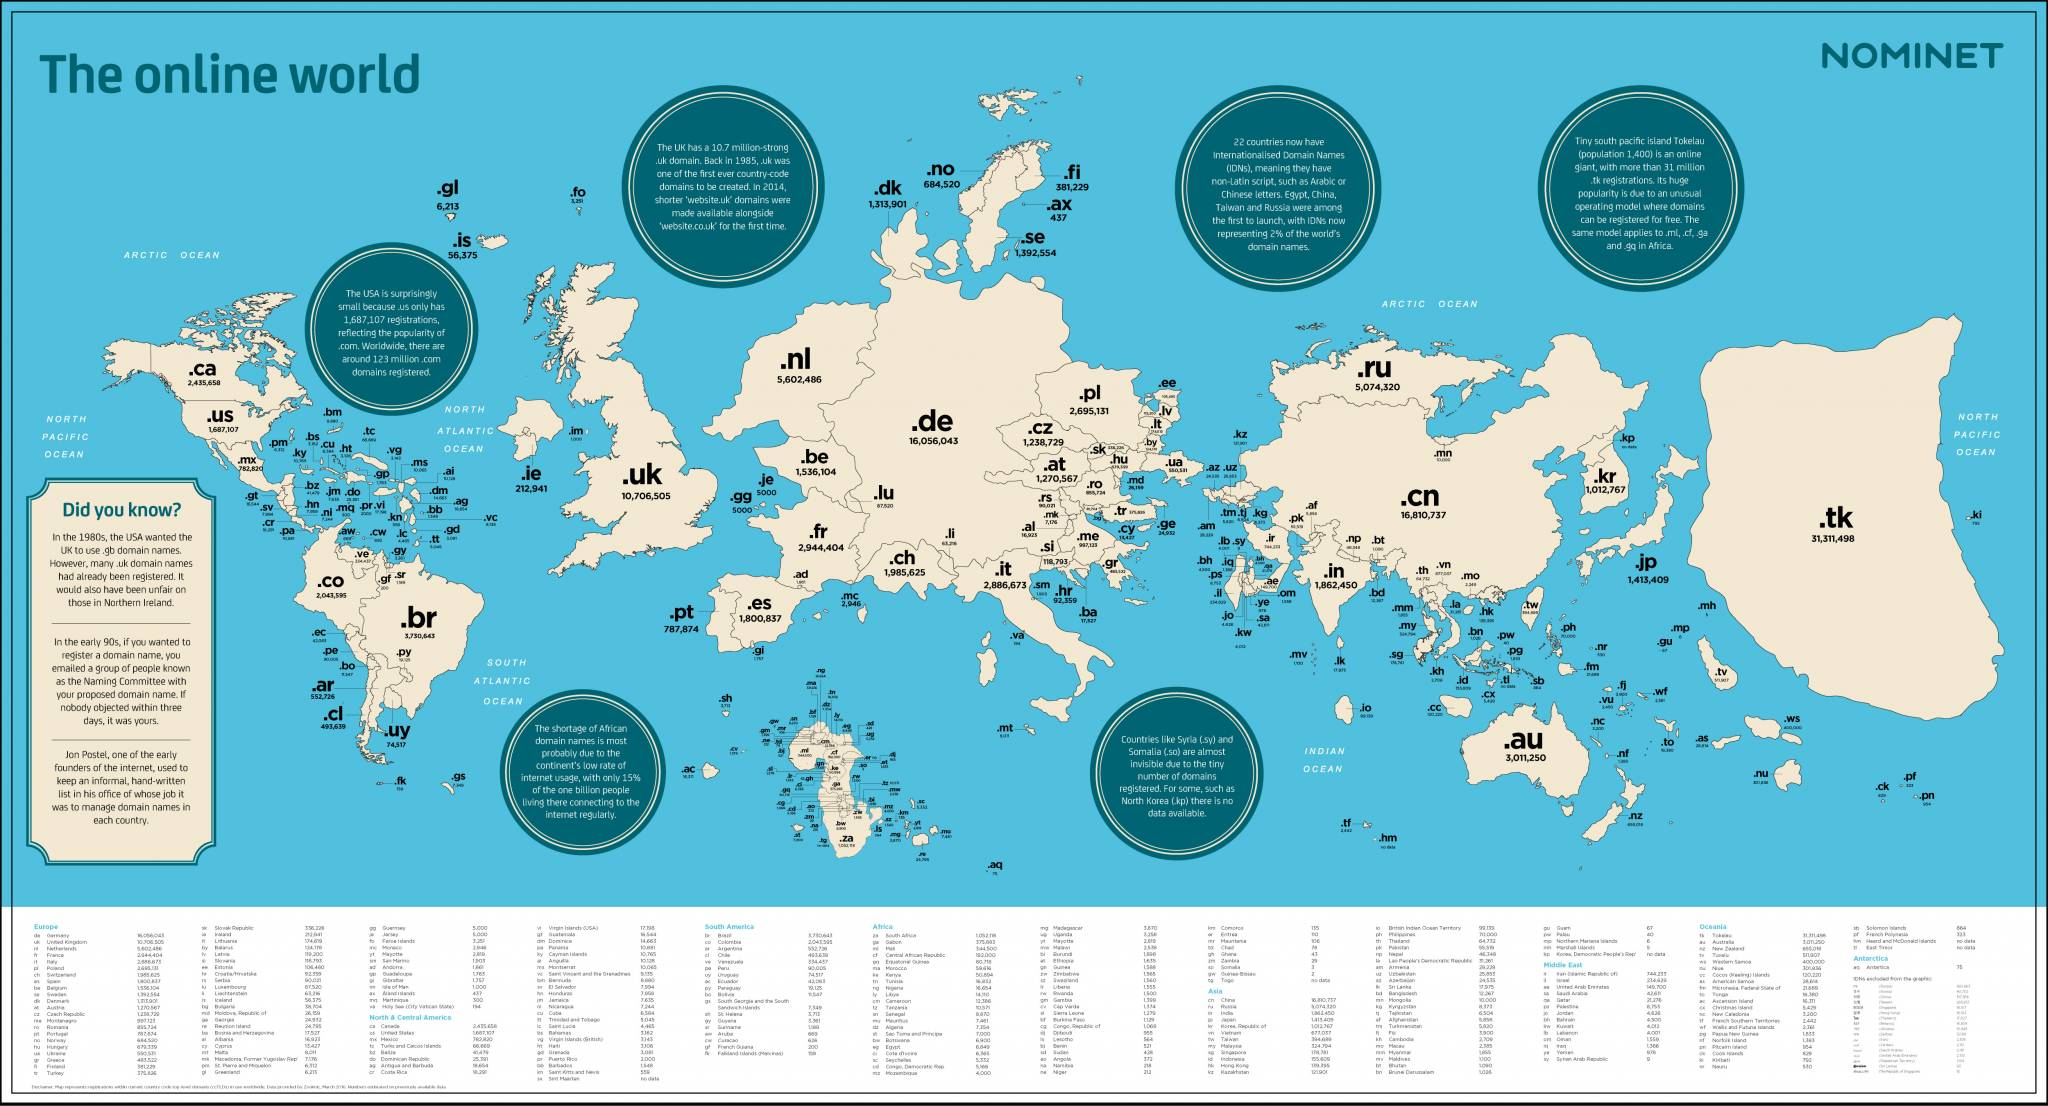
Economic Growth Over the Coming Decade
Shows exactly what it says. Countries are sized by their predicted growth and not their geograpical area. Interestingly Australia has the least predicted growth.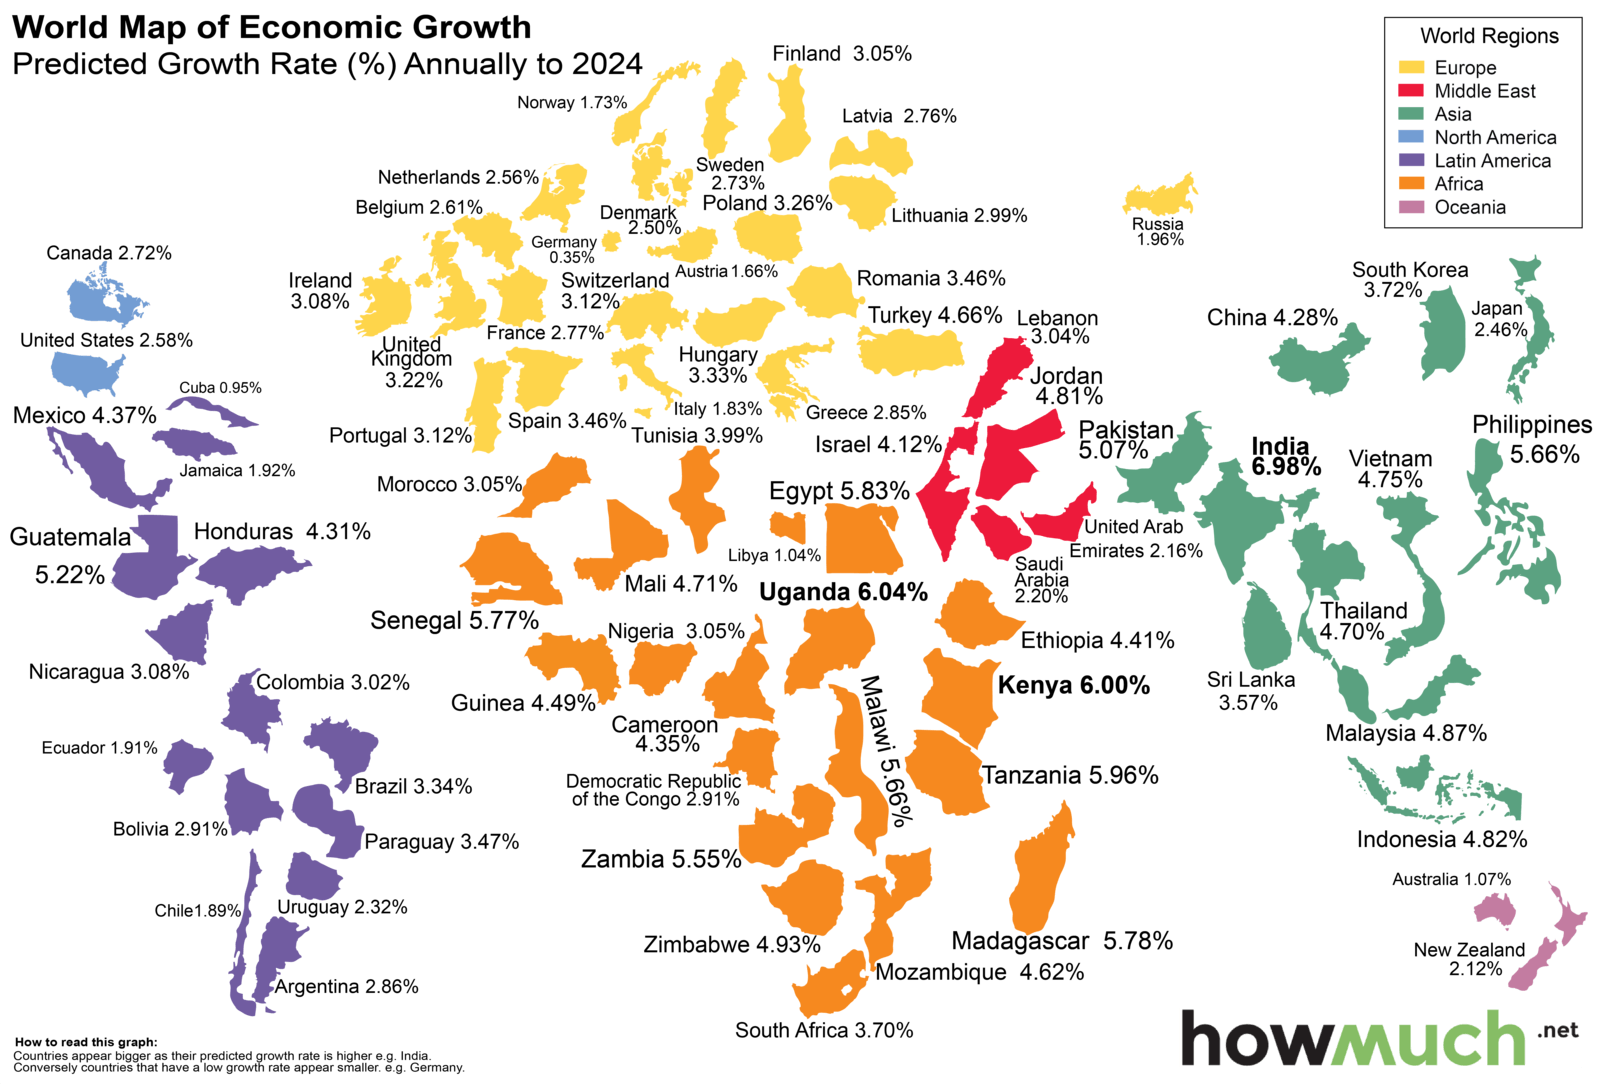
Isochronic distances
Following on from a 1914 map showing the travel distances from London, someone has updated it to the current day. Instead of taking over 40 days to reach all the places in the world, it now takes a little over one and a half days.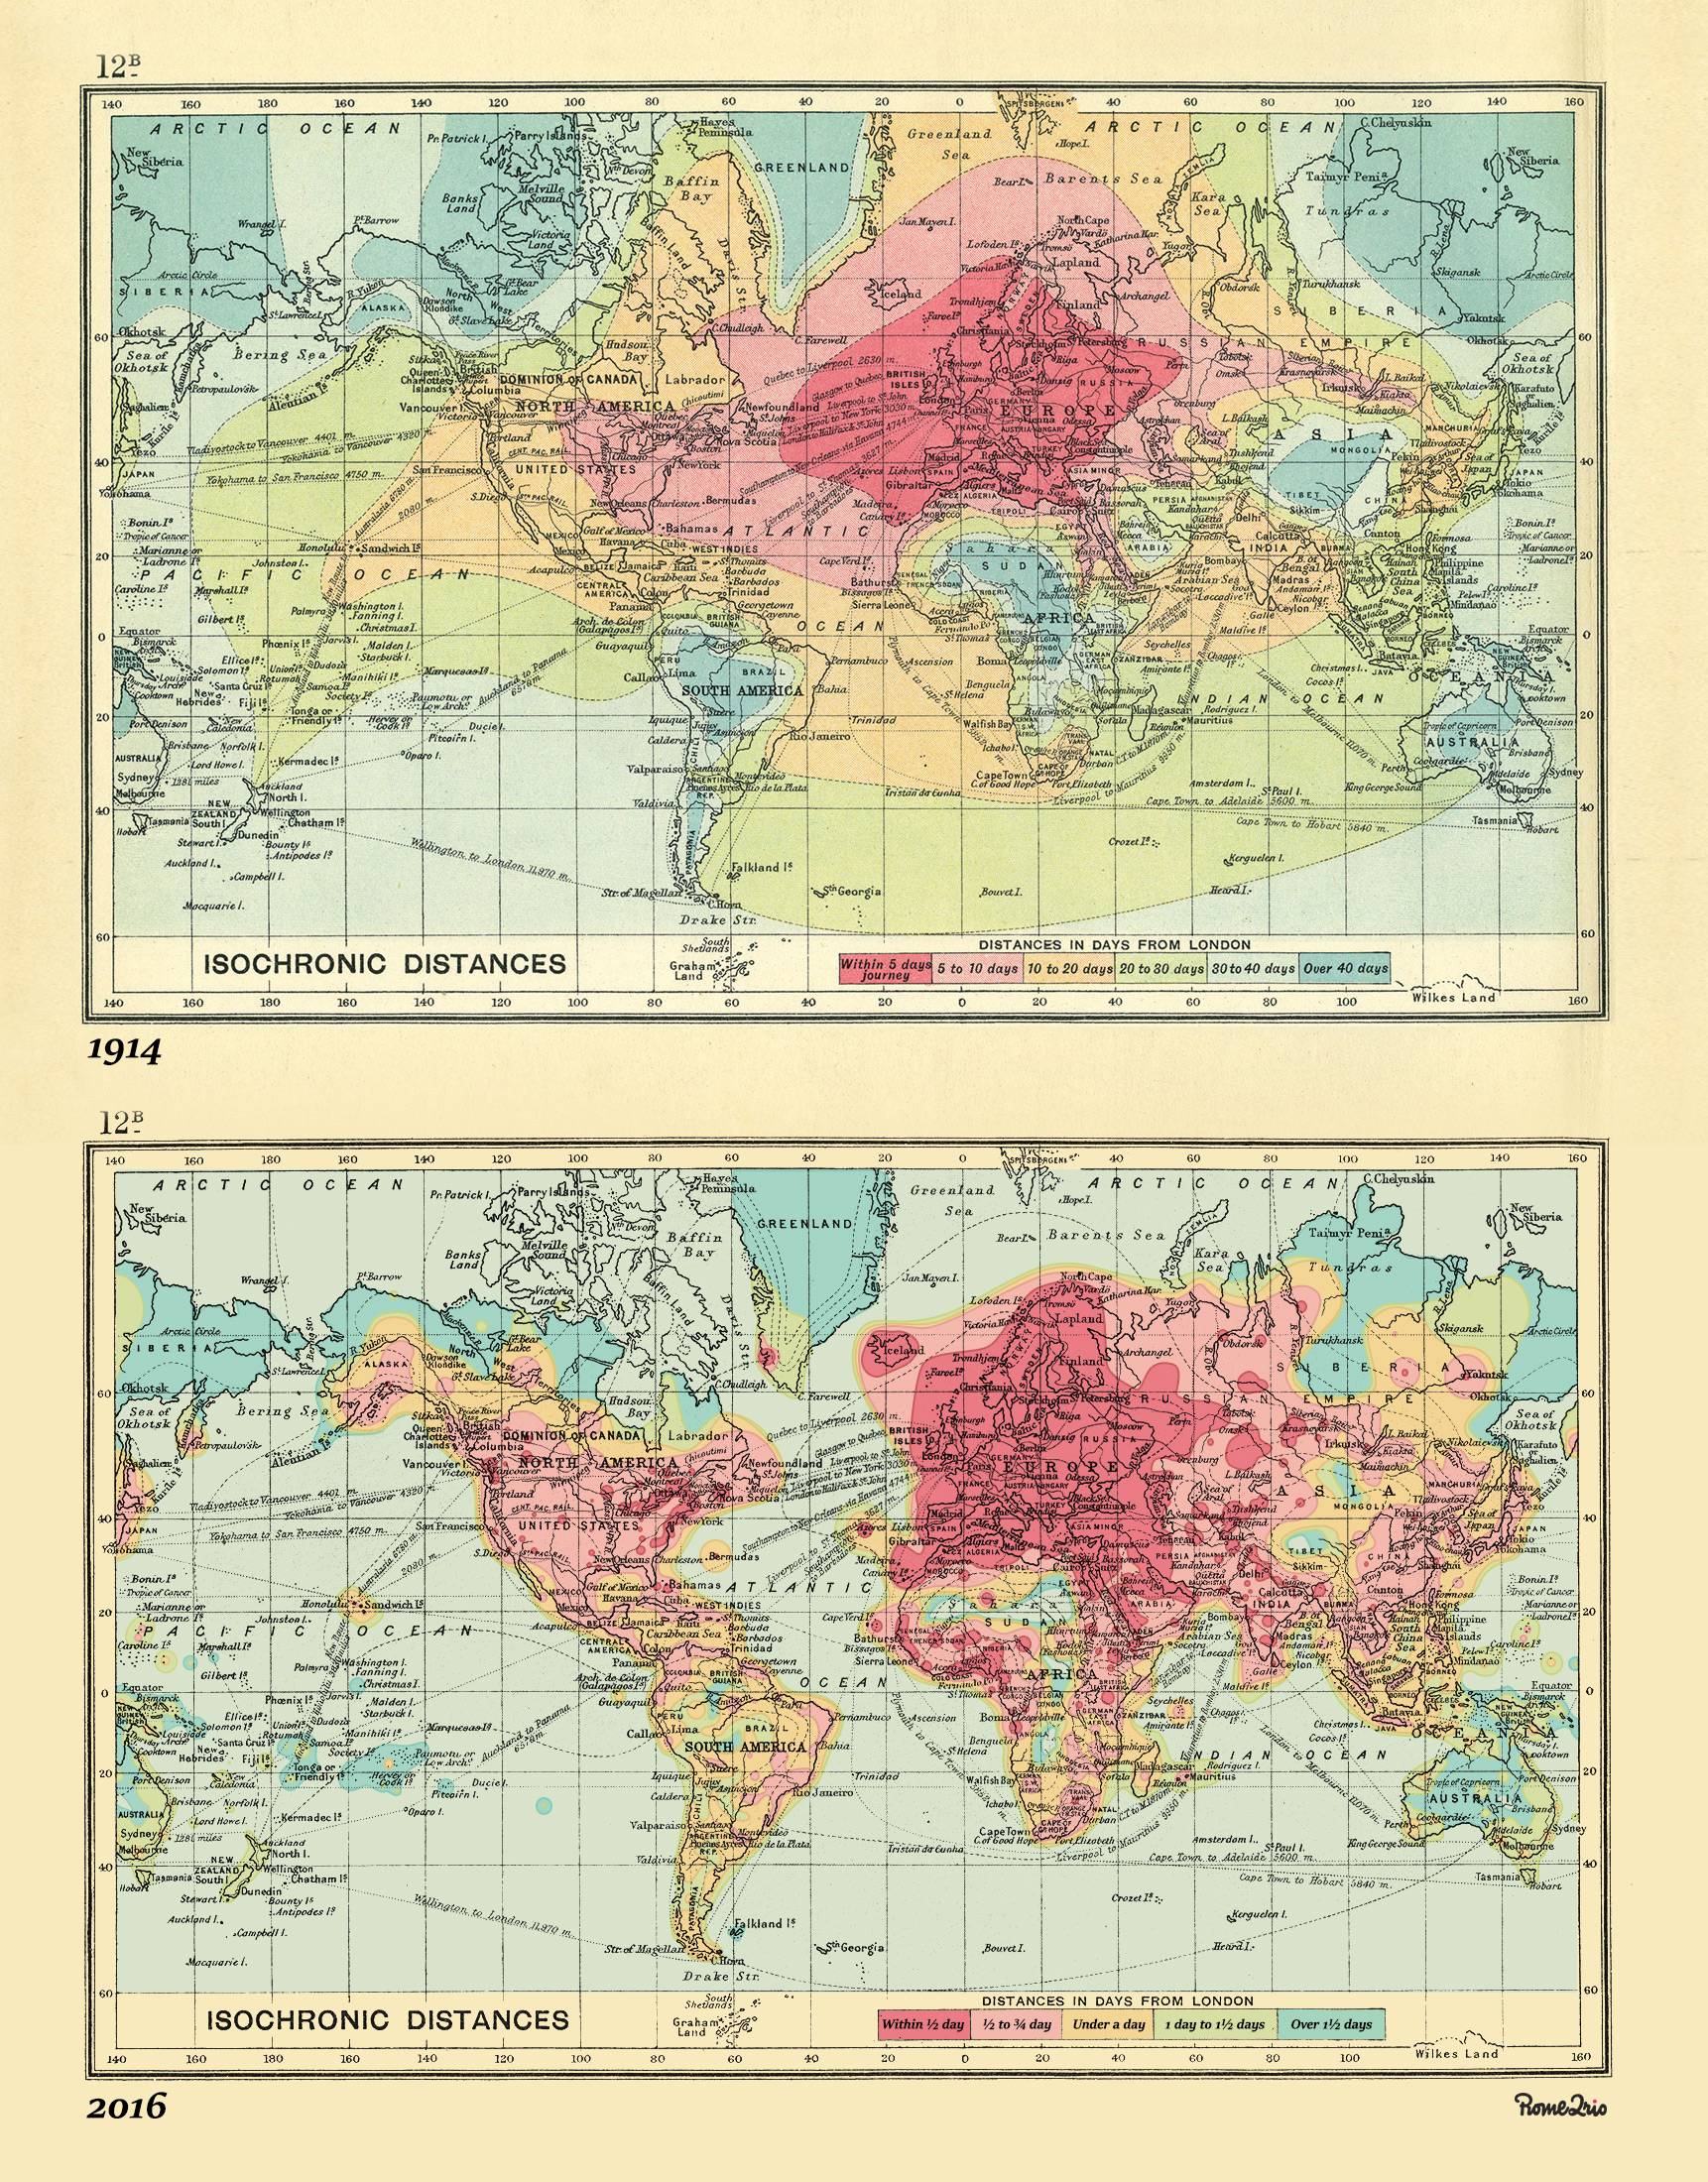
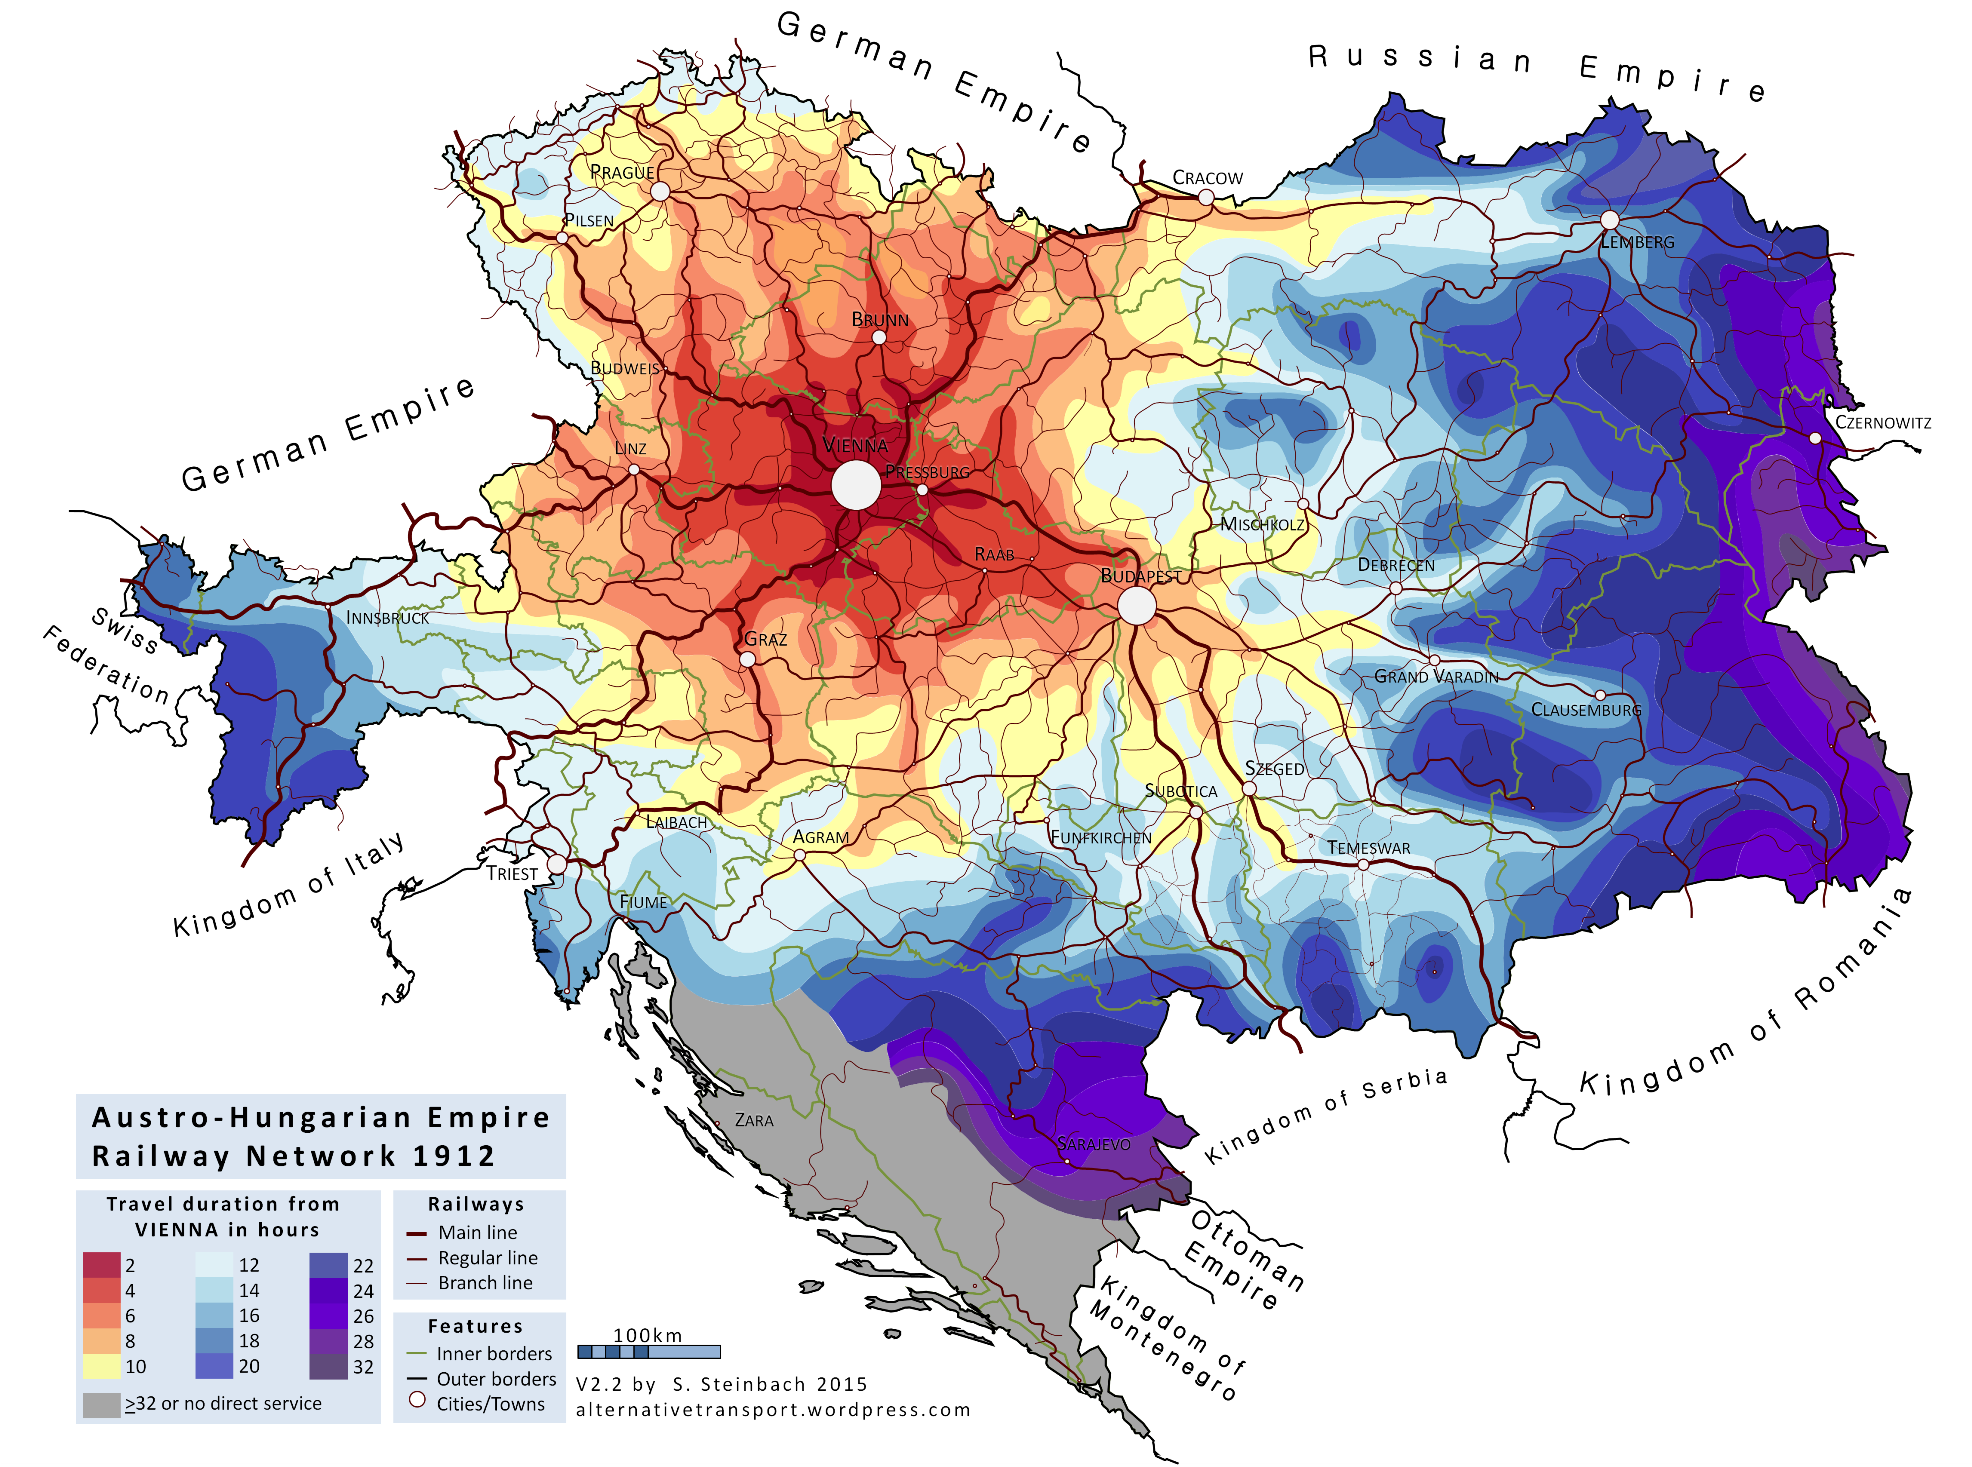
Here is an isochronic map of the Austrohungarian railway network, 1912.
Energy consumption of France
An infographic by the Cass Business School of UCL. This map shows the energy consumption in 22 regions of France as a ‘stenomap’.I do not know what a stenomap is, but it looks good.

The Role of Gender in Urban Cycling
An infographic by the Cass Business School of UCL. Basically mapping the Boris Bikes’ journeys taken by gender (blue for men, red for women). Wow! Boris Bikes are predominantly used by men!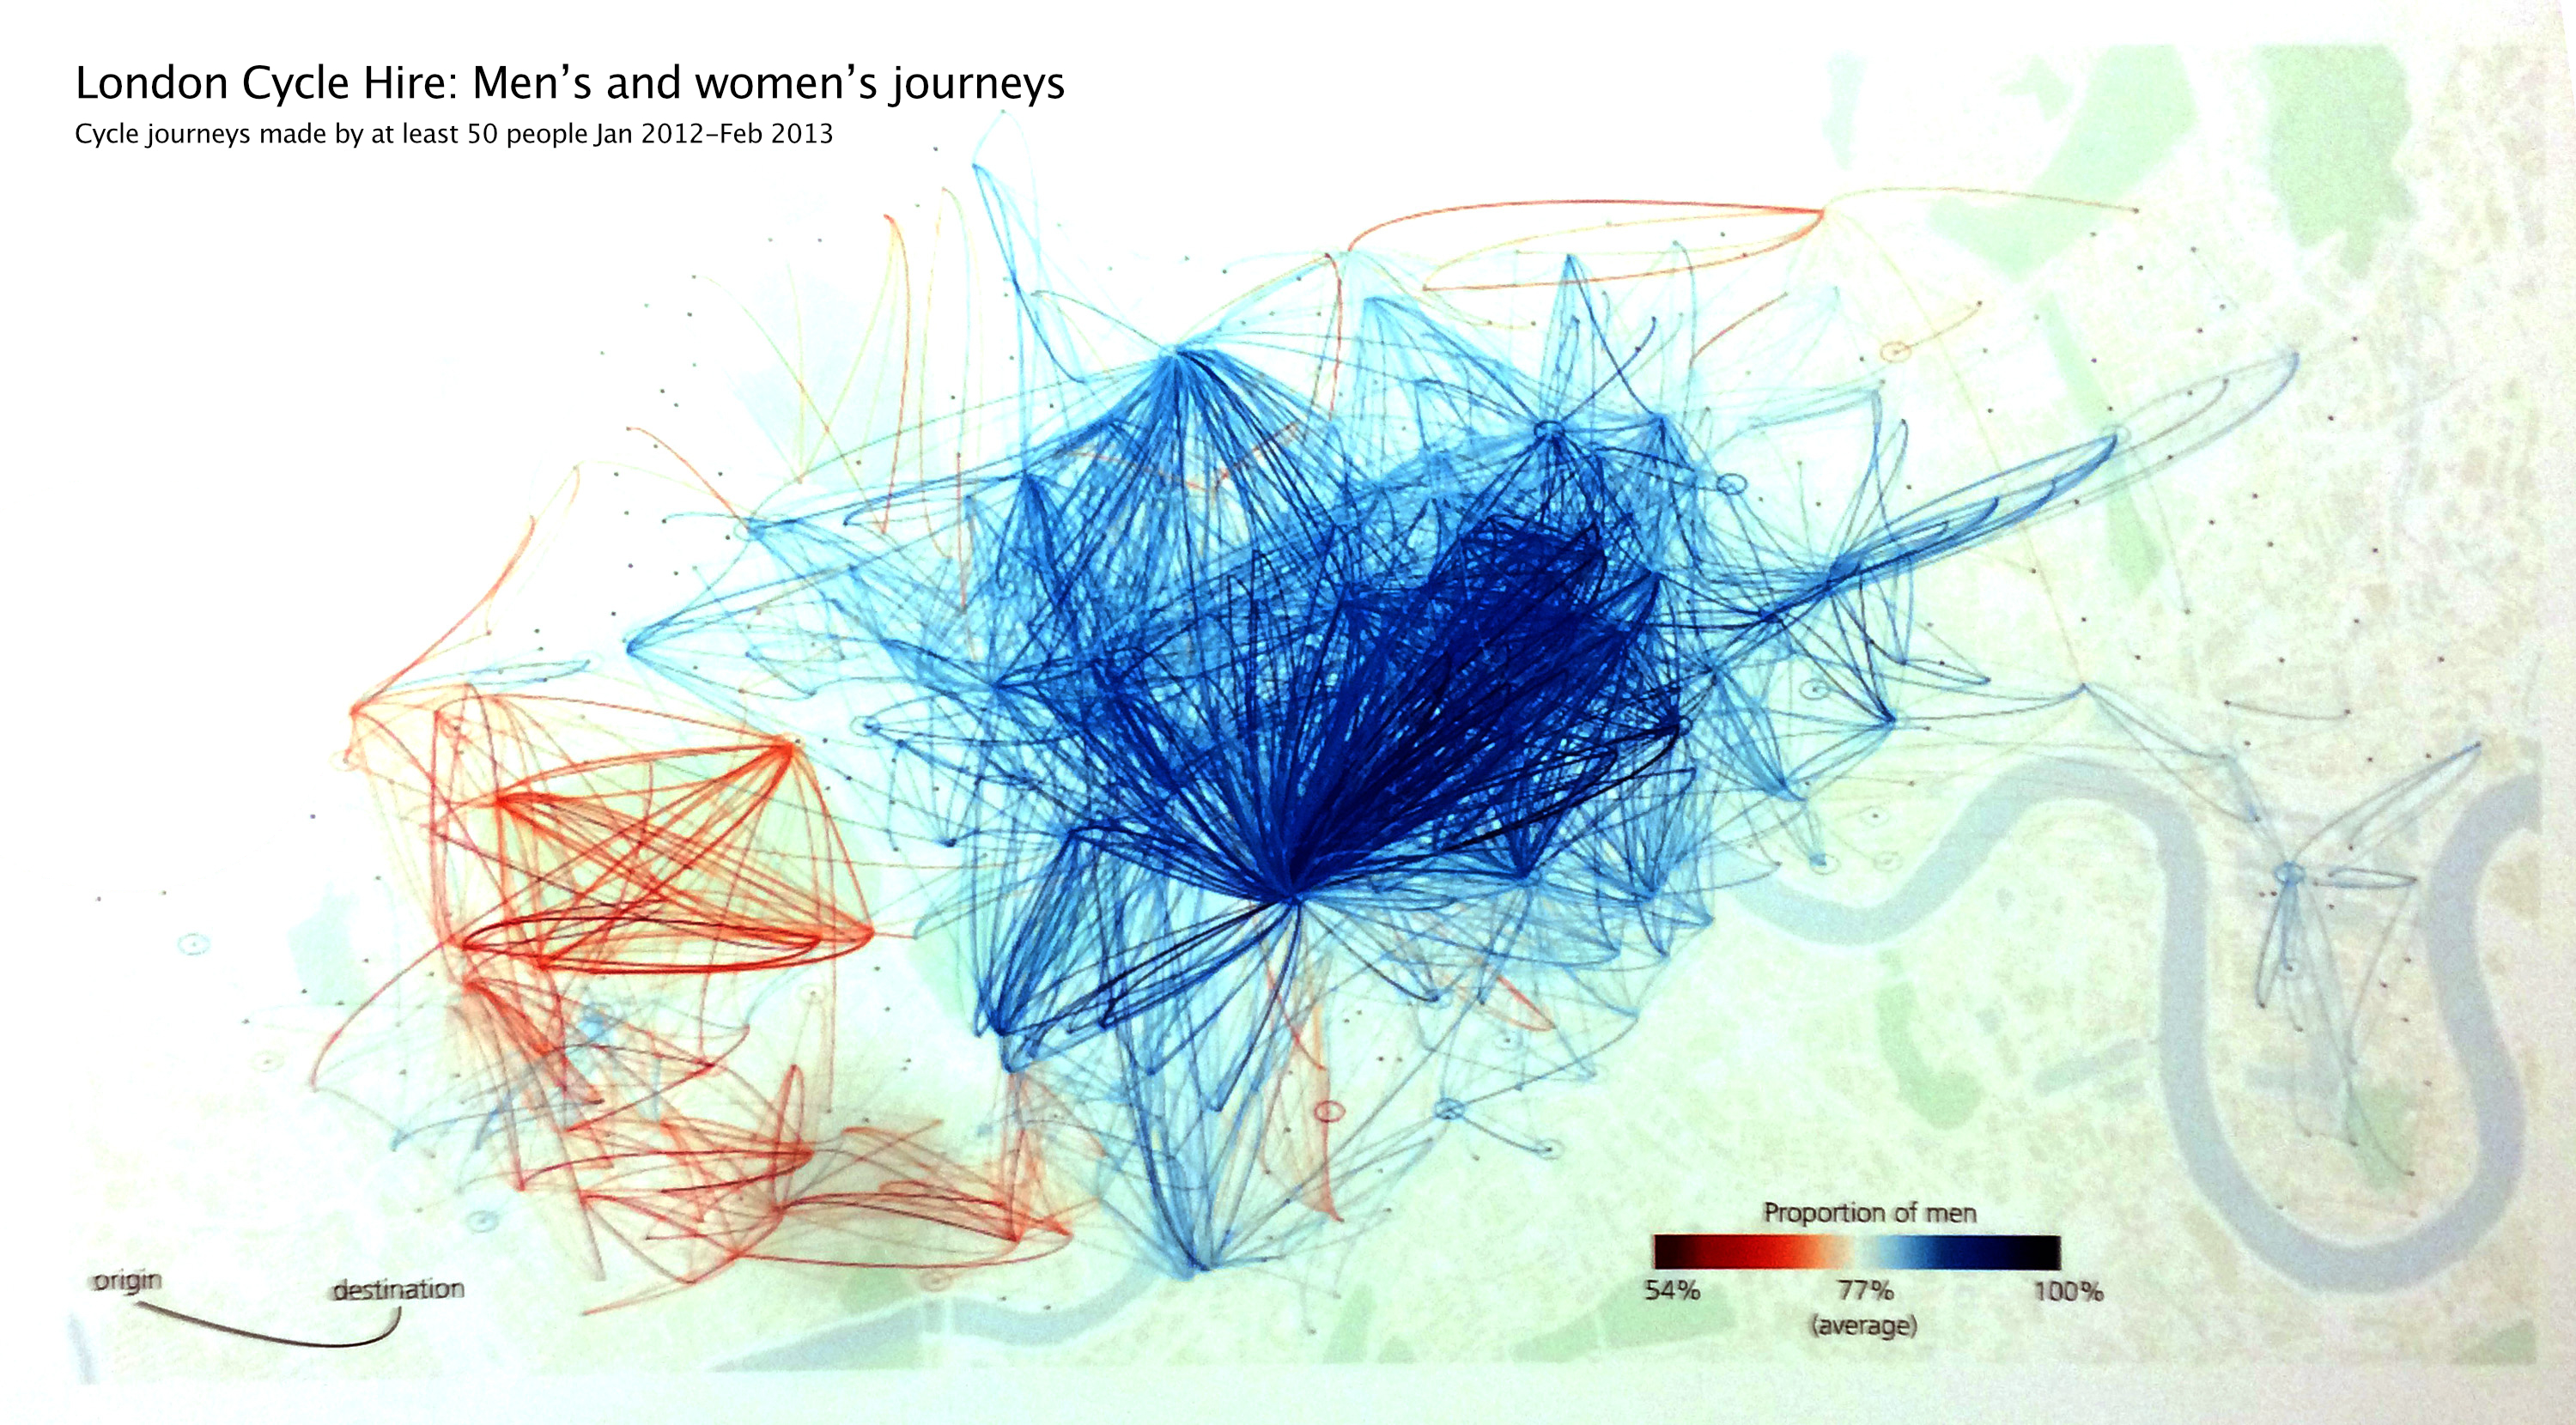
Untangling the Air Traffic Network
This map is the result of the application of a force-directed layout algorithm on a graph of 3,275 airport.