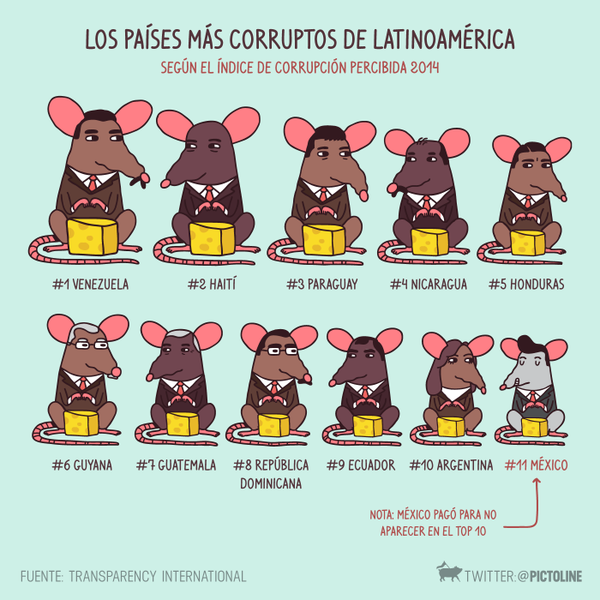
Pictoline
A Mexican twitter page (in Spanish) which has some excellent infographics, both static and animated gifs.twitter.com/pictoline
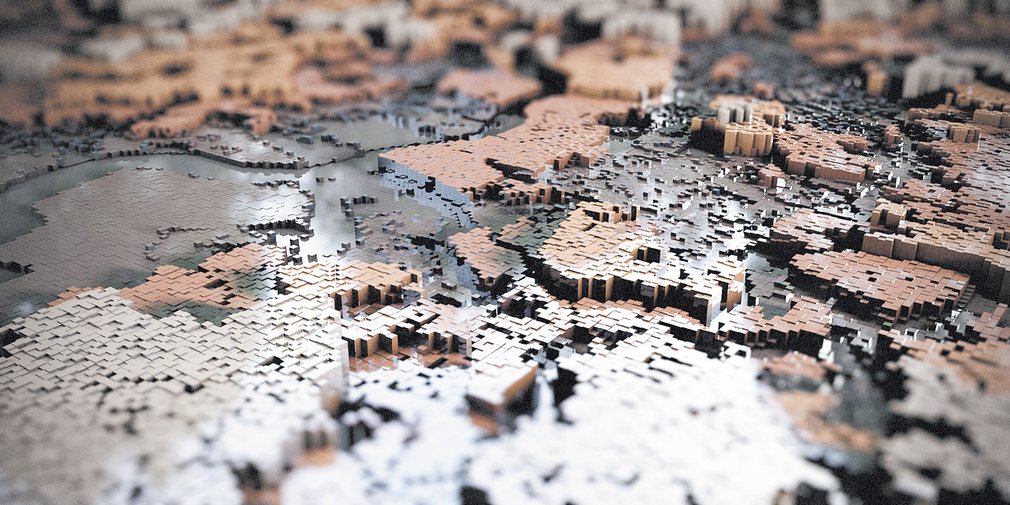
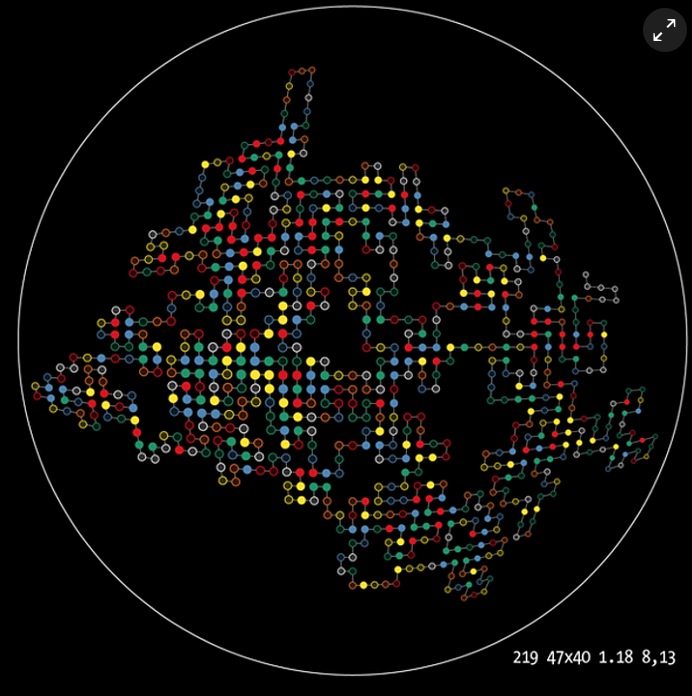
The art of gentrification: city data made beautiful
Some cool infographics representing various data about cities.theguardian.com/cities/gallery/2016/nov/30/art-gentrification-patterns-data-visualisation-herwig-scherabon-
PictolineStar Wars, Episode IV as an infographic
A very long infographic. 465152 pixels long to be precise.swanh.net
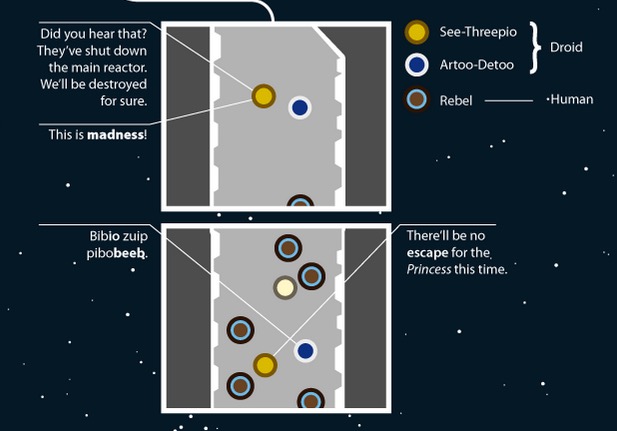
The Force accounted
With the imminent release of the seventh Star Wars movie, Bloomberg Business have done an excellent analysis and infovis of ‘The Force’ from the first six Star Wars movie.bloomberg.com/graphics/2015-star-wars-the-force-accounted

Pi Day
Pi transformed into incredible art is an article of The Guardian website where various artists have created visualisations based on the number pi.theguardian.com/science/alexs-adventures-in-numberland/gallery/2014/mar/14/pi-day-pi-transformed-into-incredible-art-in-pictures
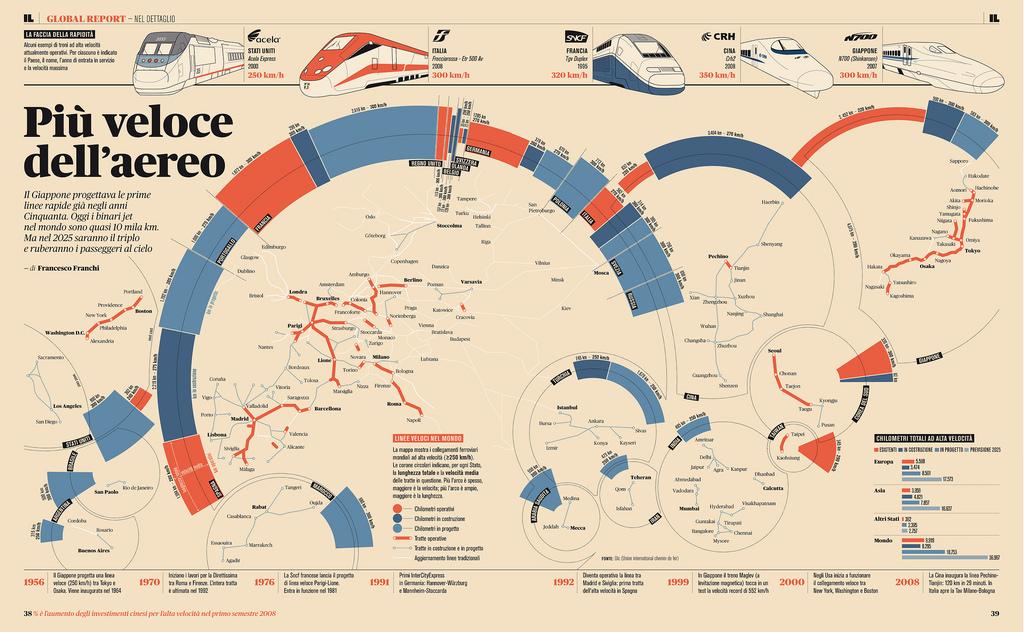
Francesco Franchi
Francesco Franchi creates amazing looking infographics for an Italian publication. You can see examples of his work on his website.francescofranchi.com/projects/infographics
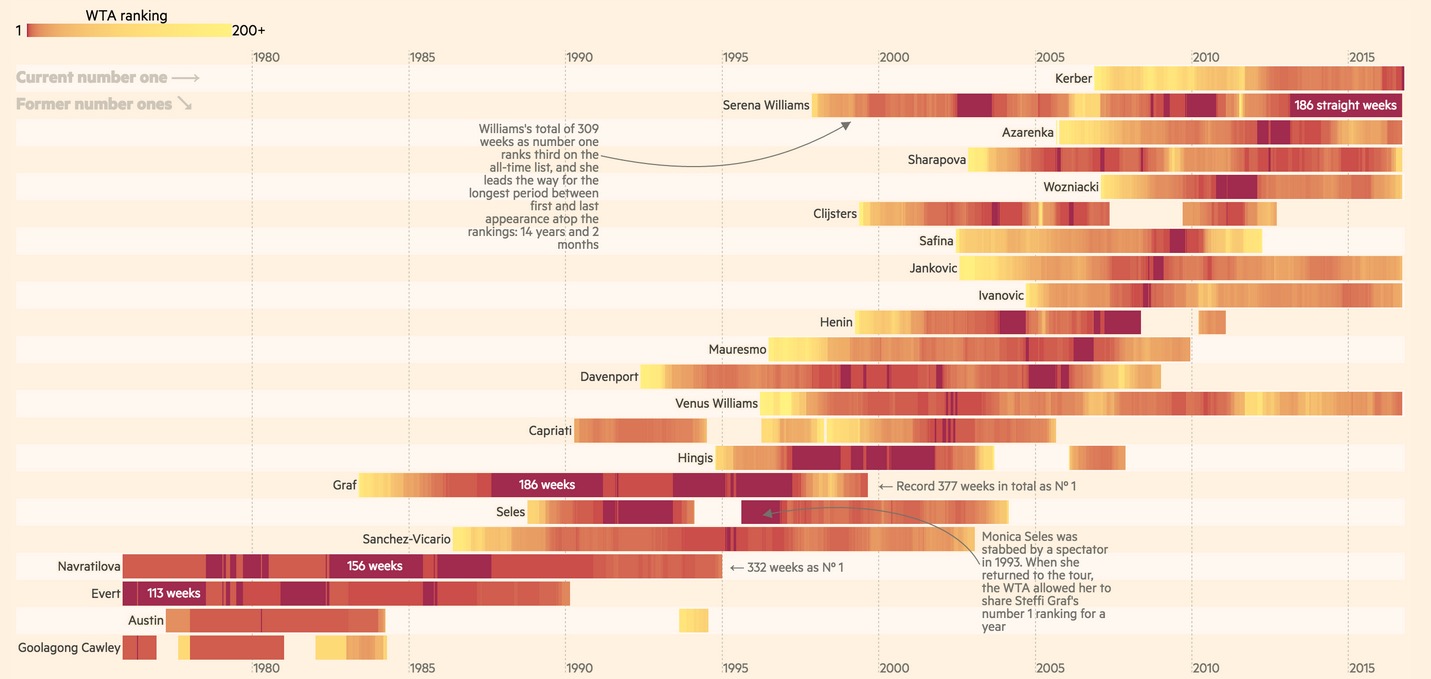
A visual history of women’s tennis
Several graphs comparing the women’s number one players.ig.ft.com/sites/visual-history-of-womens-tennis
People
The world recently reached 7 billion people in the world. On this page you can see every single one of us. One by one.7billionworld.com