SPACE
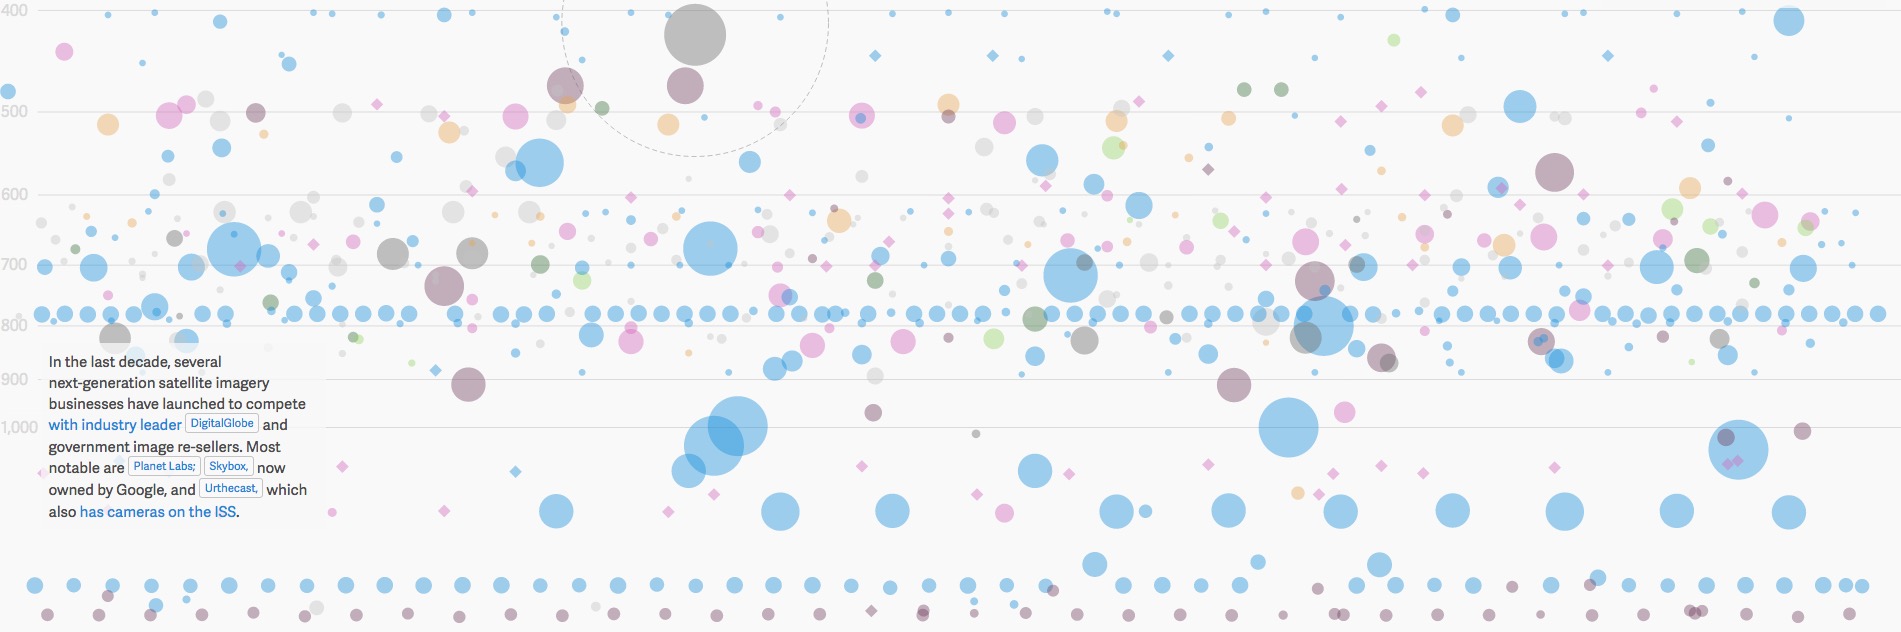
Every active satellite orbiting earth
This interactive shows more than 1,300 and gives details of each including name, purpose, launch date, country of origin and orbital distance.qz.com/296941/interactive-graphic-every-active-satellite-orbiting-earth
MUSIC
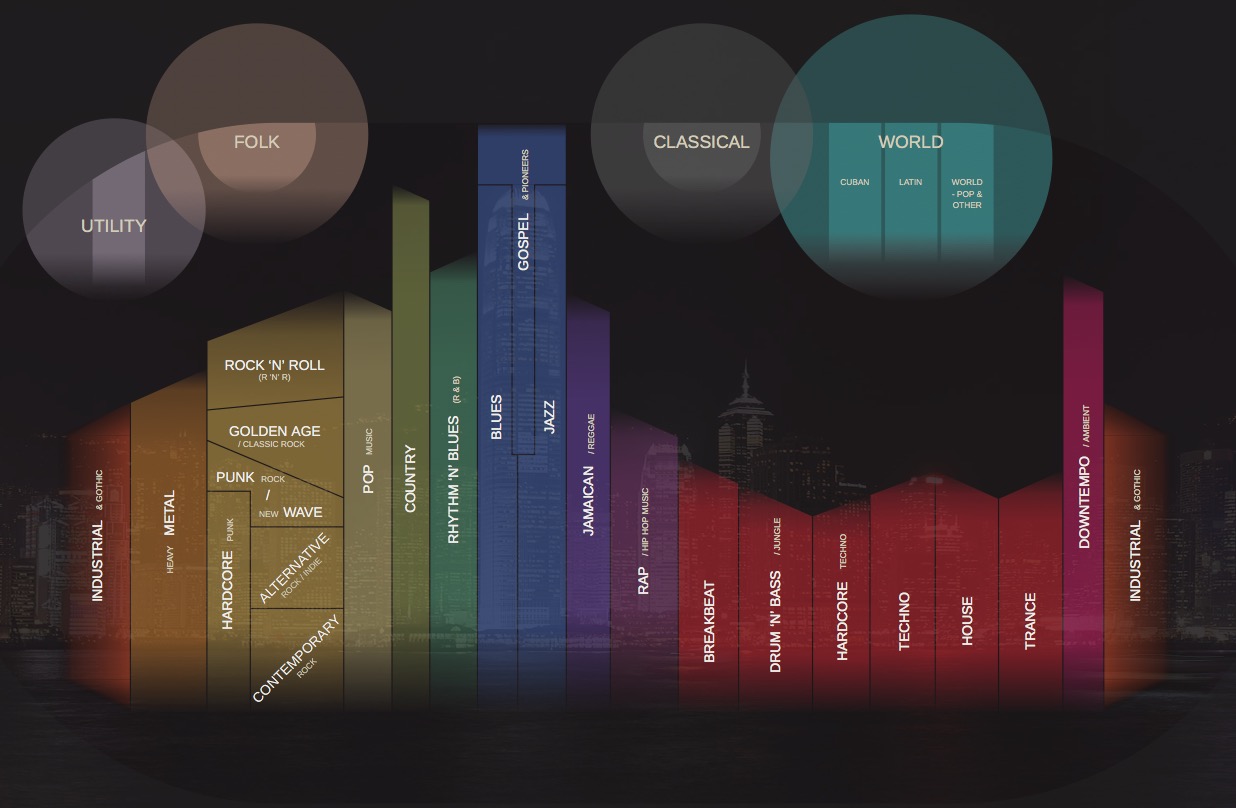
Musicmap
Musicmap attempts to provide the ultimate genealogy of popular music genres, including their relations and history. It is a highly detailed, interactive graphic which shows all the interconnections between various genres of music. There are various links to click and when you zoom in (mouse wheel or zoom buttons) there is so much more detail. Each genre has it’s own slide-in description with examples.musicmap.info
MUSIC
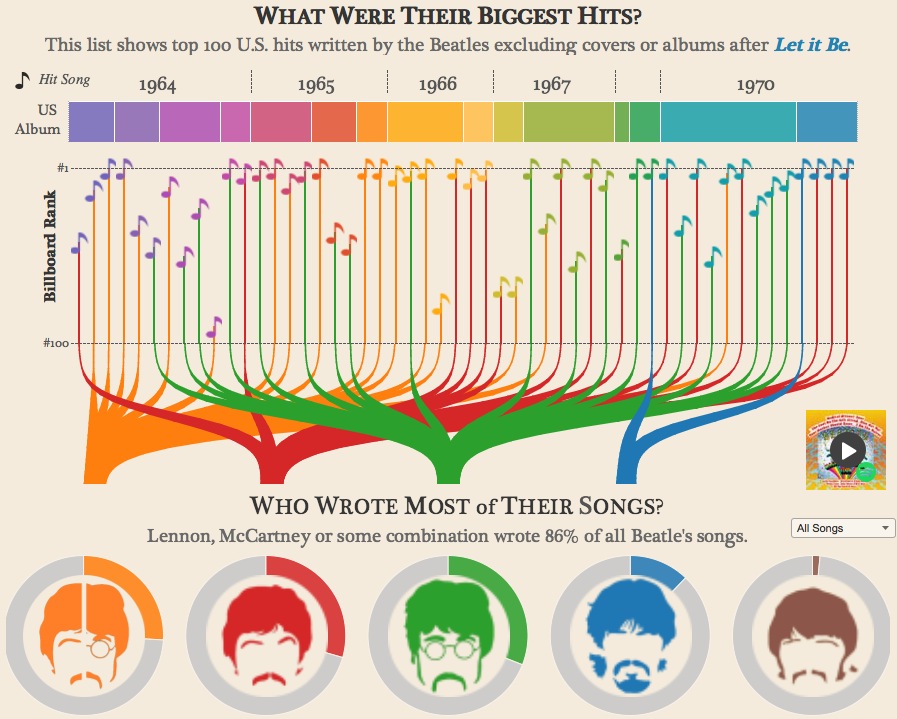
An Analysis of The Beatles
An interactive graphic which shows which Beatle wrote the most songs, what the songs are about and how big was their vocabulary.duelingdata.blogspot.co.uk/2016/01/the-beatles.html
SOCIOLOGY
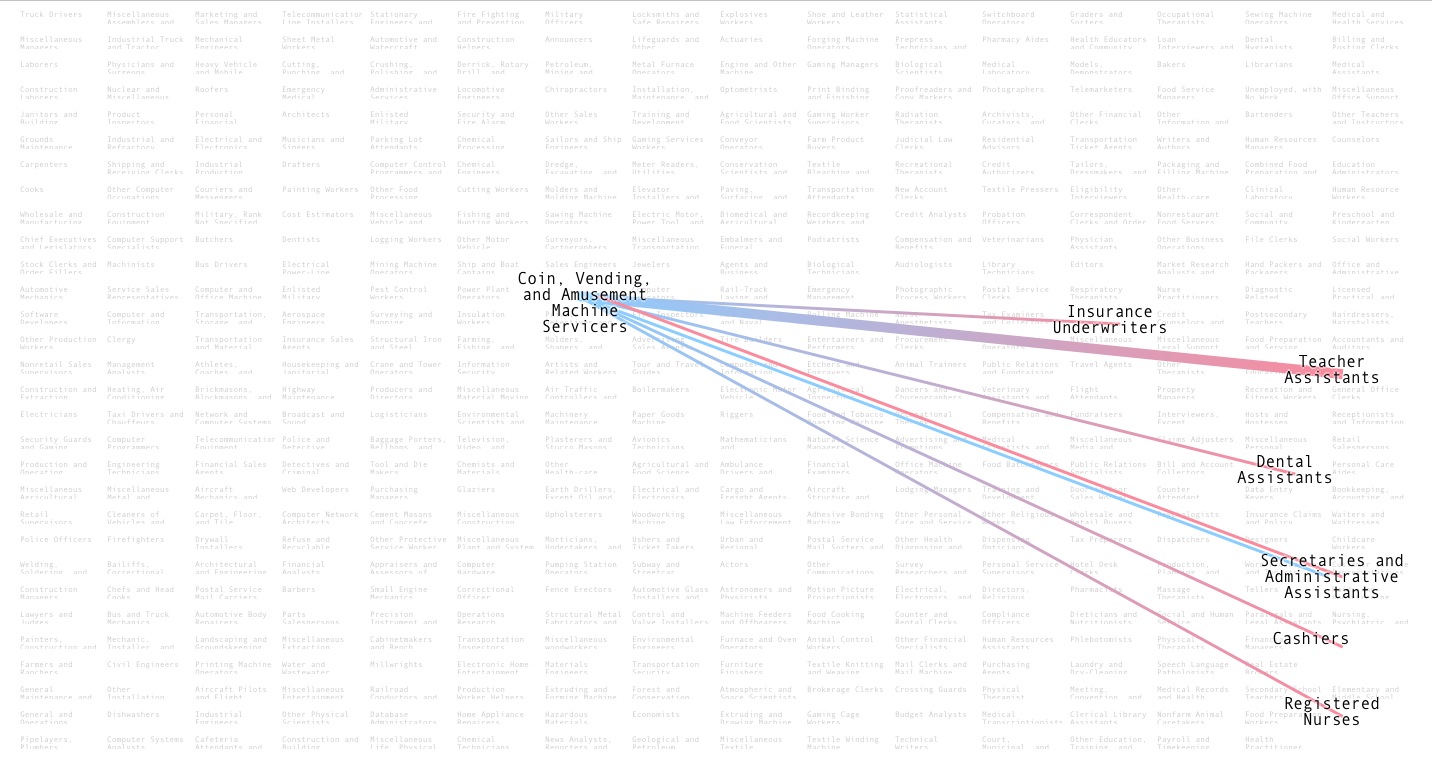
Who Marries CEOs, Doctors, Chefs and Janitors
An interactive chart from Bloomberg Business. It lists more than 400 occupations which you can rollover and see which other occupations these people are most likely to marry. The occupations are arranged by which are likely to be done by which gender, and the connecting lines show which gender of which occupations is marrying which. The above picture does not do it justice, you need to visit the site.bloomberg.com/graphics/2016-who-marries-whom
INFORMATION
Information about information – that’s so meta
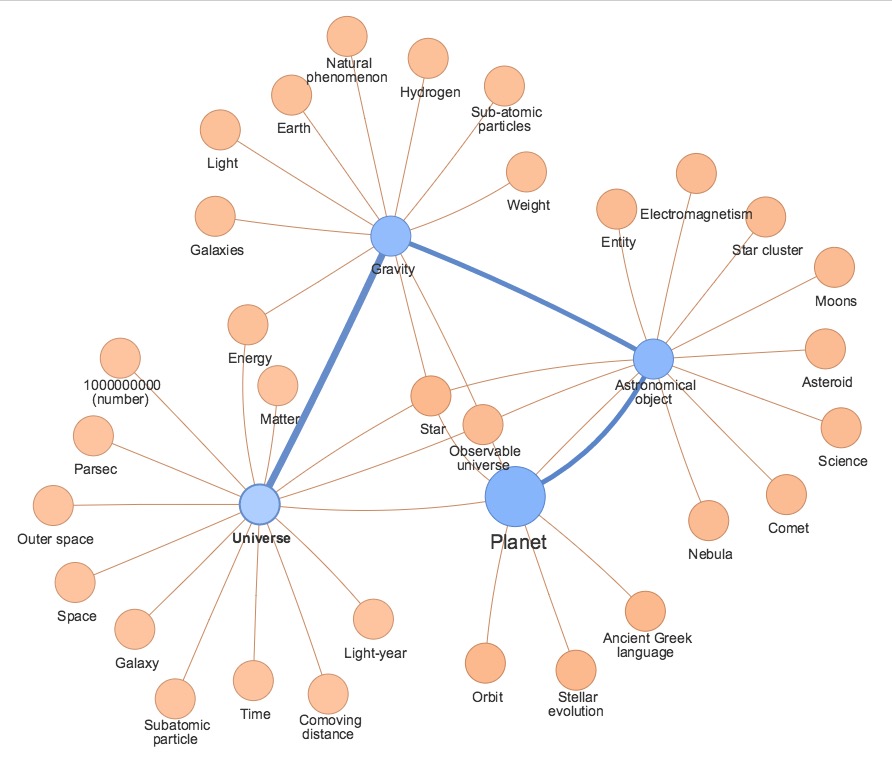
Wikimapper is an interactive web page which maps the connections between related Wikipedia articles. You enter the topic you want to start on and then click the related links to create a linkages diagram.luke.deentaylor.com/wikipedia