Iraq conflict
This is a graphic representing the various groups of people that were killed in the Iraq conflict. The square on the right has deaths ordered chronologically, the one on the left by type. It shows how data can be obscured/revealed by different representations.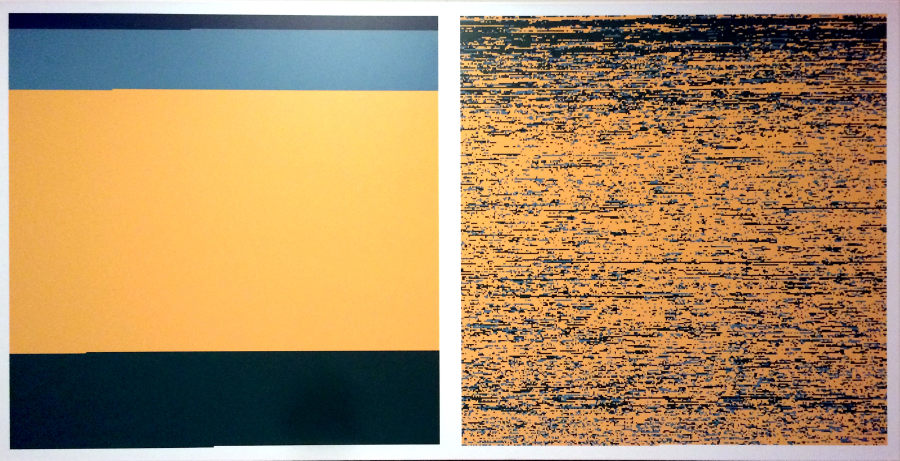
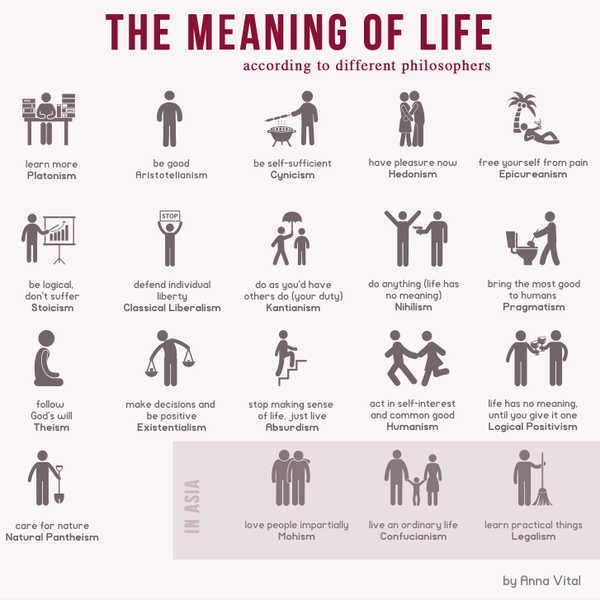
The Meaning of Life
Did You Have A Good Adventure?
A flow chart to answer that very question.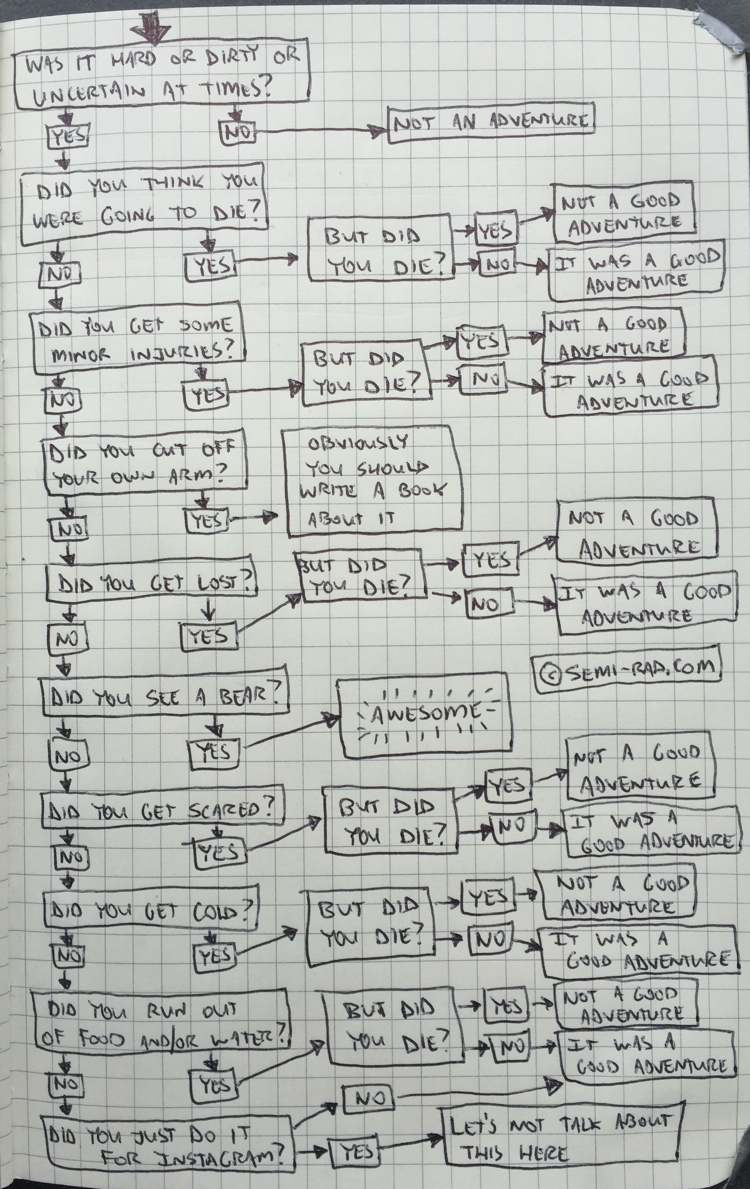
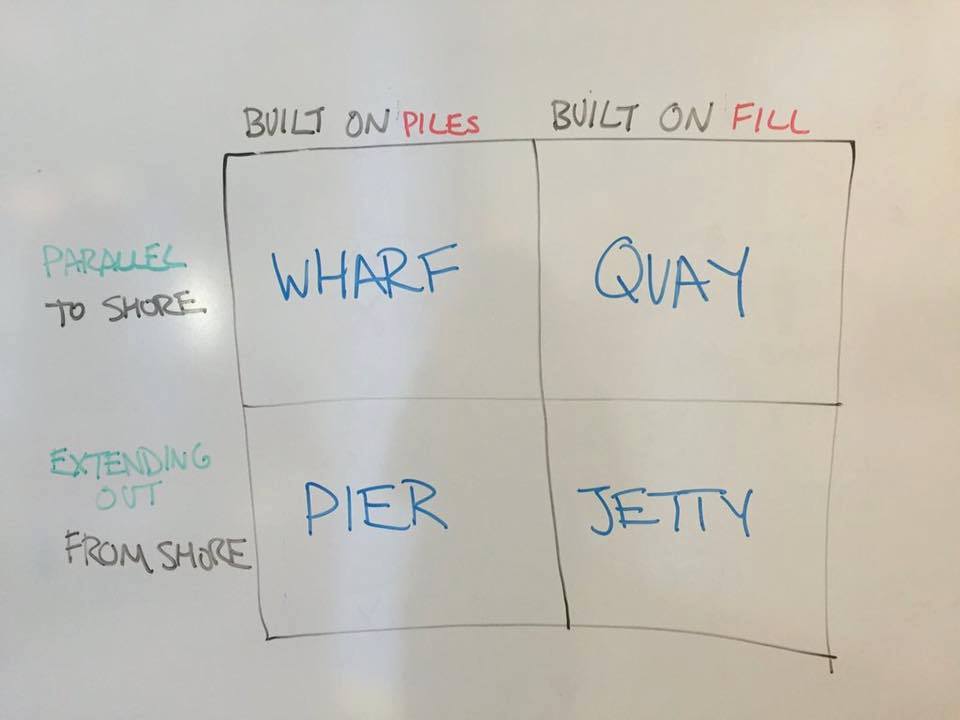
Onshore platforms
Showing that infovis doesn’t have to be complicated. A very useful diagram showing the difference between a wharf, a quay, a pier and a jetty.